

Trace a company’s earnings cadence
Review report dates, fiscal quarters, and before- or after-hours timing across a ticker’s available event history.
Pineify Finance Agent retrieves Unusual Whales earnings records for a ticker, including available report dates, fiscal quarters, EPS estimates and actuals, expected dollar moves, pre- and post-report price changes, and hypothetical straddle returns. Upcoming rows can also appear; separate them from completed events before comparing reactions.
Opens Finance Agent with an earnings-event research question ready to send.
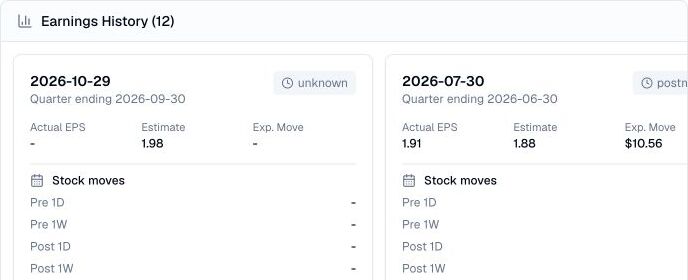
A compact history of earnings reactions
Choose a ticker and the number of records to review: 12 by default, up to 50. The tool truncates the provider response without a date filter or page selector and can reuse it for up to one hour. A request for 12 records does not guarantee 12 completed reports; check for upcoming or incomplete rows.
Historical reaction is context, not a forecast. Regime, valuation, guidance, positioning, product cycles, and the size of the surprise can all change the next outcome, so use the series to frame diligence rather than automate a trade.
Use cases
Review report dates, fiscal quarters, and before- or after-hours timing across a ticker’s available event history.
Put estimated EPS, actual EPS, expected move, and one-day or one-week stock moves side by side.
Review the provider’s hypothetical long and short at-the-money straddle returns. The one-day and one-week series use the nearest expiry at least that far after earnings, so they can involve different contracts. They are not a record of trades placed by Pineify or an investor.
Prompt examples
FAQ
Compare the event record with guidance, valuation, positioning, and current expectations before forming a view on the next report.
Open Finance AgentFor informational and research use only. No output is investment advice or a guarantee of future performance.