

Compare profitability and operating efficiency
Review gross, operating, EBITDA, and net margins alongside asset, inventory, and receivables turnover to frame questions about pricing, costs, and how efficiently the business uses its resources.
Pineify Finance Agent organizes a company’s financial ratios into one period-by-period view, from gross and net margins to liquidity, turnover, valuation, leverage, coverage, per-share, and dividend measures. Use it to see which parts of the financial story are changing, compare the pattern with a company’s own history, and choose the statements or filings that deserve closer review.
Opens Finance Agent with an Apple annual ratio question ready to send.
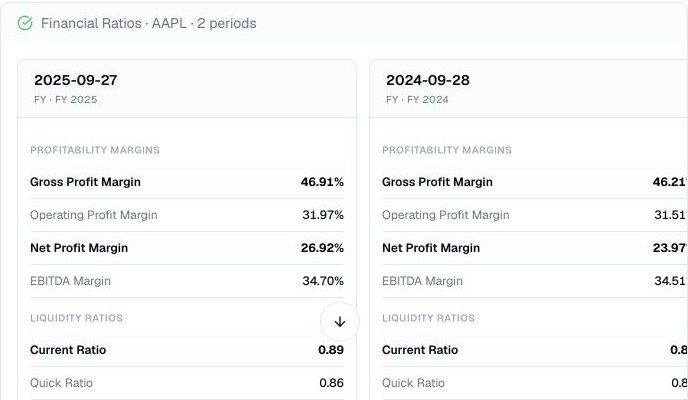
A connected ratio view
Specify a company and annual or quarterly periods. The tool keeps five returned periods by default, with a maximum of 50. The cards show date, fiscal year, period, reporting currency, and selected profitability, liquidity, efficiency, valuation, leverage, per-share, and dividend measures.
The result is a research map rather than a universal scorecard. Ratios may be calculated from reported figures and market context, and the same label can use different definitions across providers or industries. Start with the direction and relationships, then inspect the underlying statements and notes before treating a change as meaningful.
Use cases
Review gross, operating, EBITDA, and net margins alongside asset, inventory, and receivables turnover to frame questions about pricing, costs, and how efficiently the business uses its resources.
Review the card’s current, quick, cash, debt-to-equity, debt-to-assets, and leverage ratios. Interest and cash-flow coverage are additional returned fields rather than visible card rows; ask Finance Agent to inspect them when available.
Connect P/E, P/B, P/S, price-to-cash-flow, enterprise-value multiples, per-share cash and book values, dividend yield, and payout with the company’s reported operating pattern.
Prompt examples
FAQ
Use the grouped ratios to identify a pattern, then confirm dates, formulas, units, accounting context, market timing, and unusual items before relying on a comparison.
Open Finance AgentFor informational and research use only. No output is investment advice or a guarantee of future performance.