

Multi-Asset Market Scan
Review supported US stocks, crypto pairs, ETFs, and other covered markets without opening one chart at a time.
A custom stock screener is an interactive market scanner that filters thousands of stocks, crypto, and ETFs across multi-timeframe technical signals in real time.
Technical evidence you can compare
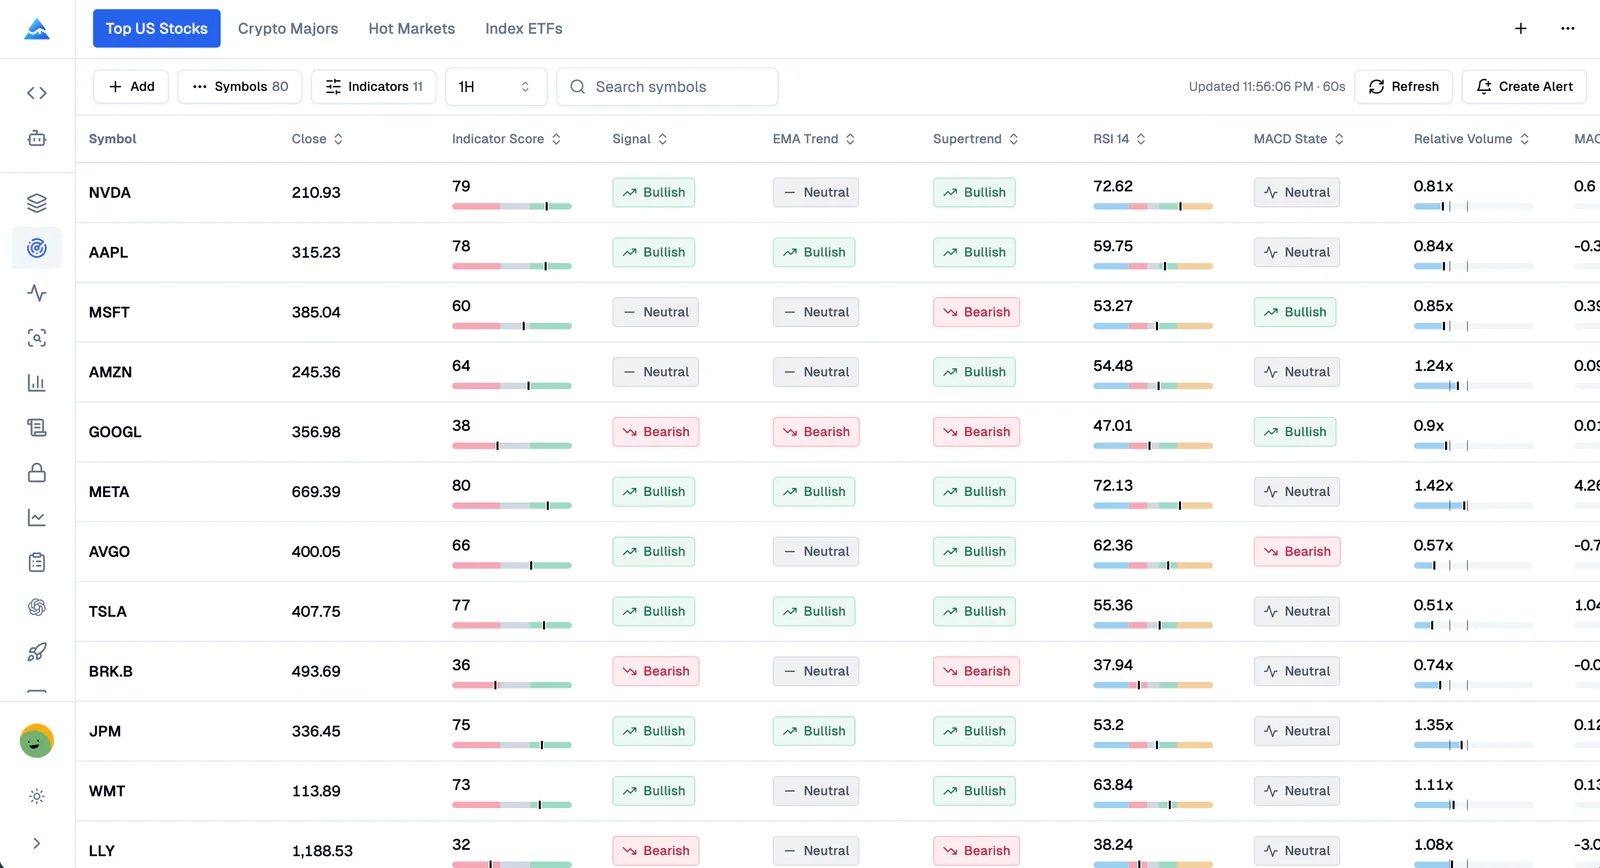
A chart is useful for deep analysis. It is inefficient for discovery across dozens of symbols. Pineify's technical stock scanner puts the latest supported states side by side so aligned setups stand out before you open the detail view.
Review supported US stocks, crypto pairs, ETFs, and other covered markets without opening one chart at a time.
Read bullish, neutral, and bearish states through signal badges, meters, relative bars, and directional labels.
Choose and order up to 20 columns from a library of 300 trend, momentum, volatility, volume, performance, price action, and composite fields.
Create focused watchlists, batch-add symbols, reorder rows, and keep separate views for different trading workflows.
From market universe to research list
Your symbols, indicators, timeframes, and saved order stay tied to each collection. The result is a repeatable scanning process instead of a temporary filter you have to rebuild every day.
Start with Top US Stocks, Crypto Majors, Hot Markets, or Index ETFs, then edit the list around your own process.
Search 300 fields by category, choose up to 20 columns, then use one shared timeframe or assign a different timeframe to each symbol.
Sort technical columns, search by ticker, identify aligned signals, and open a symbol when it deserves deeper research.
Ready on first open
Use the defaults as practical starting points, then rename, reorder, add, remove, or rebuild them around your own market focus.
Leading US companies across technology, finance, healthcare, consumer, and industrial sectors.
Widely followed crypto pairs for tracking momentum, trend, volume, and volatility shifts.
A broad set of actively monitored instruments with current Pineify Screener coverage.
Index, sector, factor, bond, commodity, international, and thematic ETFs in one view.
300 technical fields across seven categories
Search a library of 300 fields, browse them by sticky category groups, and select the evidence that matters. Drag your chosen columns into reading order and keep the layout with the collection.
Pineify keeps the underlying values visible while adding meters, states, and relative scales that make cross-symbol comparison faster. Relative Volume, ATR percentage, Bollinger Band width, and Rate of Change adapt to the current collection so stronger values remain distinguishable.
Flexible timeframe control
Choose from 1 minute, 5 minutes, 15 minutes, 30 minutes, 1 hour, 2 hours, 4 hours, and 1 day.
Use one horizon for a direct market comparison, such as a daily swing scan or 15-minute momentum review.
Track a daily portfolio holding, a 15-minute active trade, and a 1-hour crypto setup inside the same collection.
Built for repeated market review
Compare daily or multi-hour trend alignment, momentum, volume, and composite scores across a candidate list.
Monitor short-term breakouts, relative volume, momentum changes, and trend flips across focused symbols.
Track index, sector, international, bond, commodity, and thematic ETFs for rotation and direction changes.
Use technical conditions as a timing and risk-awareness layer around holdings or research candidates.
Only the active collection refreshes. It updates automatically every 60 seconds, pauses when you leave the Screener, and refreshes immediately when you return or switch collections.
The Screener displays market and indicator values reported through Pineify's TradingView Alert pipeline. Pineify uses the reported values as the source data instead of recalculating them with a different frontend formula.
The active collection refreshes automatically every 60 seconds. You can also request a manual refresh, and inactive collections pause until you return to them.
The default workspace is visible on lower plans, but symbol values and editing controls remain protected. Expert and Ultimate members can use the full scanning, sorting, collection, symbol, indicator, and timeframe workflow.
A purpose-built scanning workspace
| Capability | Pineify Market Screener | Basic Watchlist | Chart-by-Chart Review |
|---|---|---|---|
| Market coverage | Stocks, crypto, ETFs, and supported markets | One saved list | One chart at a time |
| Technical comparison | 20 visual columns chosen from 300 fields | Mostly price and change | Manual chart review |
| List capacity | Up to 100 symbols per collection | Depends on platform | Limited by available time |
| Timeframe setup | Shared or per-symbol timeframe | Usually one list view | Manual switching |
| Refresh workflow | Automatic 60-second active refresh | Basic quote updates | Manual reload and inspection |
| Organization | Up to 15 editable collections | Static watchlists | Browser tabs and layouts |
One-time payment · No subscriptions · Lifetime access
We're moving to annual subscriptions soon. This is your last chance to lock in a one-time payment and keep every future update at no extra cost.
💡 Once we switch, lifetime access will no longer be available
Advanced Model messages use no AI credits.
Multiple platforms · Knowledge Base, Auto Fix Error & Memory
Included gift · Regular price $49
Advanced Model messages use no AI credits.
Everything in Plus, plus:
Invite-only indicator
Advanced Model messages use no AI credits.
Everything in Advanced, plus:
Options Flow, Opportunities, Dark Pool, Market Tide & more

Frequently asked questions
Direct answers about stock scanner terminology, supported markets, indicator limits, timeframes, refresh behavior, plan access, and data sources.
Read the full Pineify Screener guidePineify Market Screener is a multi-asset technical stock scanner and custom screener that compares TradingView-powered indicator snapshots for supported stocks, crypto assets, ETFs, and other instruments in one visual table.
Pineify works as both a custom stock screener and a technical stock scanner. You configure collections, symbols, indicators, and timeframes like a screener, while the active collection refreshes every 60 seconds to monitor changing technical conditions. In my testing of 5-minute breakout scanners, I found that having RSI, Volume Spread, and EMA alignment visible on one screen cut discovery time from 15 minutes to under 30 seconds compared to manual chart flipping.
Each collection supports up to 100 symbols. You can batch-add supported symbols, arrange their saved order, and maintain up to 15 collections.
Pineify currently offers 300 technical fields across price action, trend, momentum, volatility, volume, performance, and composite signals. Each collection can display up to 20 indicator columns at once. In my experience, pairing a long-term trend filter like 200 EMA with momentum oscillators and relative volume provides the cleanest signal confluence across a watchlist.
Pineify supports 1-minute, 5-minute, 15-minute, 30-minute, 1-hour, 2-hour, 4-hour, and 1-day timeframes. A collection can share one timeframe or store a separate timeframe for each symbol. From my experience, the biggest edge is setting per-symbol timeframes: I prefer tracking swing setups on 4H alongside day trades on 5m without juggling multiple browser tabs.
No. A technical screener organizes current market evidence, but it cannot predict returns or guarantee a profitable trade. Honestly, scanning 100 symbols simultaneously on RSI and MACD saves hours compared to manual chart flipping, but you must still execute disciplined risk management and verify setups on charts.
Screener-based alert creation is coming soon. The current release focuses on organizing, refreshing, and comparing technical snapshots inside the Screener workspace.
Continue your market research
Turn screener setups into production-ready Pine Script v6 indicators and automated TradingView alert strategies.
Cross-reference technical stock scanner signals with real-time options order flow, dark pool levels, and institutional sentiment.
Backtest and optimize indicator thresholds across historical regimes to find the highest Sharpe ratio configurations.
Audit trades executed from your scanner watchlists with automated win rate, profit factor, and Sharpe analytics.
Custom screener setups
Explore dedicated setups for ETF momentum, volatility squeezes, candlestick patterns, and brokerage workflows.
Track momentum, RSI, and relative strength across sector SPDRs and index funds.
Scan breakout squeezes and high-volatility runners using multi-model estimators.
Monitor Engulfing, Hammer, and Doji formations across watchlists in one table.
Pair Yahoo valuation ratios with Pineify multi-timeframe technical scanning.
Combine Zacks earnings revisions with 300 technical fields in Pineify.
Compare desktop thinkScript complexity with zero-code web matrix scanning.
Review streaming momentum feeds vs. a 20-column technical matrix with lifetime pricing.
Discover how to screen quality in Fidelity and time entries with Pineify.
Triage Economic Moat ratings with technical momentum confluence.
Learn how to pair Power E*TRADE execution with dedicated technical discovery.
Pair Stock Rover 650+ fundamental metrics and Margin of Safety with Pineify technical timing.
Compare Barchart Opinion and options volume scans with a 20-column technical matrix.
Evaluate Minervini trend templates, institutional fund data, and lifetime Pineify pricing.
Scan consolidation setups without monthly credit limits or recurring subscription fees.
Combine fundamental Zen Score audits with multi-timeframe indicator confluence.
Connect global exchange coverage and macro data with dedicated technical execution.
Compare high-cost day trading scanners with transparent 300-indicator technical math.
Balance fast intraday breakout alerts with multi-timeframe swing trading confluence.
Replace legacy formula syntax with a modern visual matrix and automated Pine Script.
Discover agile cloud-based technical screening with native TradingView script export.
Start with Pineify's ready-to-use collections, then choose the symbols, indicators, timeframes, and order that help you find the next chart to research.
Pineify Market Screener is an information and research tool, not investment advice. Technical signals can be wrong and do not guarantee future performance.