

Trace amounts and payment cadence
Compare available cash dividends and payment frequency across records to spot increases, reductions, special distributions, or gaps that deserve explanation.
Pineify Finance Agent can organize a stock’s available dividend records into cash amounts, yield context, payment frequency, ex-dividend dates, record dates, declaration dates, and payment dates. Use the timeline to compare distributions over time and decide which income or dividend-sustainability questions to investigate next.
Opens Finance Agent with a focused Coca-Cola dividend-history question ready to send.
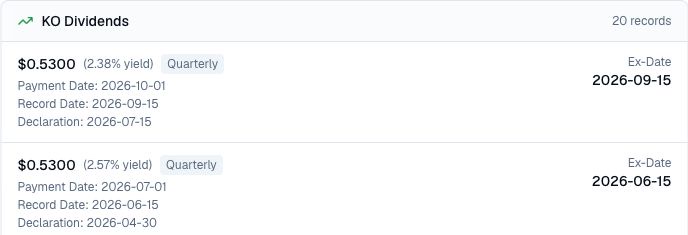
Dividend timeline at a glance
A dividend record is more than one payment amount. Finance Agent places the available declaration, ex-dividend, record, and payment dates beside each distribution so you can understand the sequence and compare the company’s reported cadence over time.
The timeline can include both historical and scheduled records. Upcoming payments can change, and a displayed yield may use a different price or annualization basis than another source, so current details should be confirmed through company investor relations and a timestamped market source.
Use cases
Compare available cash dividends and payment frequency across records to spot increases, reductions, special distributions, or gaps that deserve explanation.
Keep declaration, ex-dividend, record, and payment dates distinct when researching eligibility, timing, and the company’s distribution cycle.
Use the history to guide deeper work on payout ratios, free-cash-flow coverage, leverage, cyclicality, management policy, and competing capital needs.
Prompt examples
FAQ
Review the amount and schedule, then verify upcoming dates and investigate earnings, free cash flow, payout policy, debt, and capital-allocation priorities before relying on future income.
Open Finance AgentFor informational and research use only. No output is investment advice or a guarantee of future performance.