

Compare recent and longer windows
Review average targets for the last month, quarter, year, and all-time coverage to see whether the near-term picture differs from the longer record.
Pineify Finance Agent puts a stock’s average analyst price targets into one timeframe-aware view. Compare the last month, last quarter, last year, and all-time averages alongside the number of analyst estimates and the available publishers. Use the changes in coverage and averages to frame expectations and decide which individual notes need review—not as a promise that the stock will reach any target.
Opens Finance Agent with an Apple price-target summary question ready to send.
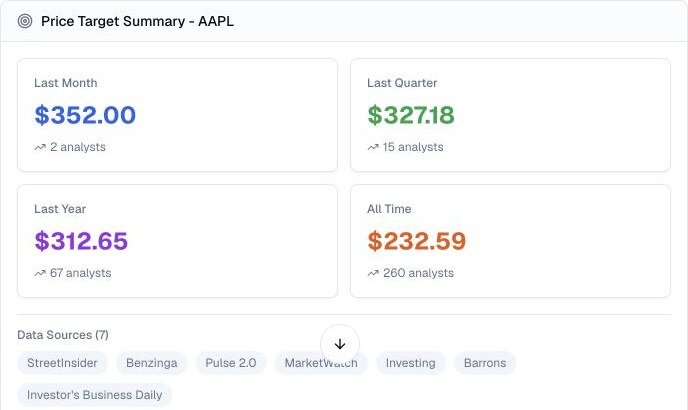
A timeframe-aware target view
Request one ticker to see FMP’s last-month, last-quarter, last-year, and all-time averages and coverage counts. These are overlapping coverage windows in one response, not four consecutive periods or a history of one analyst’s revisions. The tool does not accept a historical as-of date or a custom window.
An average is a measurement of available published targets, not a valuation model or a guaranteed outcome. Read the dates, horizons, currency, publisher mix, and source notes before treating a target as useful evidence.
Use cases
Review average targets for the last month, quarter, year, and all-time coverage to see whether the near-term picture differs from the longer record.
See how many analyst estimates sit behind each timeframe so a small recent sample is not mistaken for a broad consensus.
Read the publisher names as leads for separate research. The card lists names without article links, and does not map each publisher to a target, analyst, or time window.
Prompt examples
FAQ
Compare the windows, then verify target dates, currency, horizon, assumptions, and current company evidence in the underlying analyst notes.
Open Finance AgentFor informational and research use only. No output is investment advice or a guarantee of future performance.