

Compare short-term moves
Review one-day, five-day, one-month, three-month, six-month, and year-to-date changes without checking each period separately.
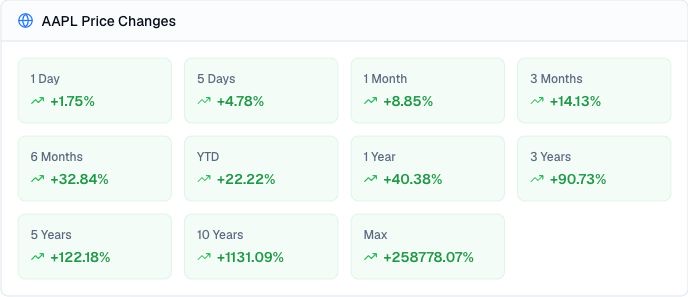
Pineify Finance Agent can place a stock’s available percentage price changes across short, medium, and long timeframes in one view, from one day and five days through year to date, ten years, and the longest available history. Use it to distinguish a recent move from the stock’s broader price path before investigating what changed.
Opens Finance Agent with an Apple multi-period price-change question ready to send.
One stock, many horizons
Choose a ticker to retrieve FMP’s fixed set of price-change percentages. There is no custom start or end date, historical as-of query, benchmark comparison, or annualization control in this tool. Compare the named horizons together; they overlap and should not be added to produce a longer-period return.
The result is a compact price-performance view, not an explanation of the move. It does not establish business quality, valuation, risk, or what the stock will do next, and the displayed card does not provide the observation date or calculation basis.
Use cases
Review one-day, five-day, one-month, three-month, six-month, and year-to-date changes without checking each period separately.
Place the recent move beside one-, three-, five-, and ten-year changes and the longest available lookback.
Use a difference between timeframes to guide follow-up research into catalysts, financial performance, valuation, corporate actions, and market conditions.
Prompt examples
FAQ
Review the timeframes together, then investigate company news, filings, earnings, valuation, corporate actions, and market conditions before interpreting the pattern.
Open Finance AgentFor informational and research use only. No output is investment advice or a guarantee of future performance.