

Map an analyst’s covered companies
See the symbols, recommendation direction, firm, and recommendation date together to understand the breadth and mix of the analyst’s available coverage.
Pineify Finance Agent gathers the available point-in-time ratings associated with a named analyst, showing the covered symbol, recommendation, date, firm, action, price target, track-record context, and source article when available. Use the view to understand which companies an analyst is covering, compare the direction of their calls, and follow the original notes before drawing a conclusion.
Opens Finance Agent with a Wamsi Mohan coverage question ready to send.
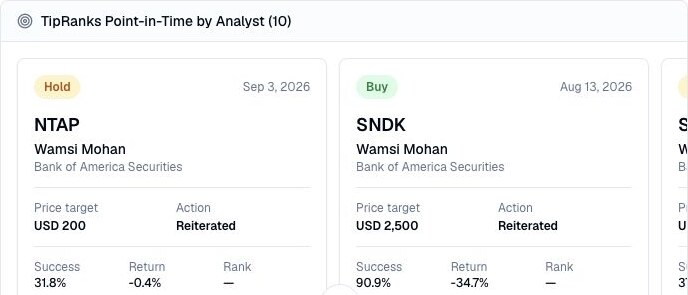
A cross-stock analyst view
Provide the exact published analyst name or profile identifier and, for historical research, a specific as-of date. The provider selects the latest active call for each covered symbol on or before that date. Results start with ten rows and can include up to 50 per request; ask for subsequent pages before treating the snapshot as complete.
The snapshot is an index of available observations rather than a complete portfolio or a live recommendation feed. Treat it as a way to choose follow-up research, then read the linked coverage and check the company’s own disclosures.
Use cases
See the symbols, recommendation direction, firm, and recommendation date together to understand the breadth and mix of the analyst’s available coverage.
Compare initiated, maintained, upgraded, downgraded, and reiterated views to distinguish a new opinion from a follow-through update.
Review available price targets, success rate, historical return, and source articles beside each call while keeping backward-looking measures separate from forecasts.
Prompt examples
FAQ
Use the dated coverage view to choose which companies and notes deserve deeper work, then verify the source date, target currency, methodology, and current business evidence.
Open Finance AgentFor informational and research use only. No output is investment advice or a guarantee of future performance.