

Measure institutional participation and scale
Review the number of holders, ownership percentage, 13F shares, and total invested value to frame how broadly institutions report exposure to the stock.
Pineify Finance Agent retrieves FMP’s institutional-position summary for a stock, year, and quarter. The card groups holder counts, 13F shares, ownership percentage, reported value, position-change counts, and available put/call totals. It describes reported holdings for that period, not current trades or a complete list of managers.
Opens Finance Agent with an Apple institutional-position question ready to send.
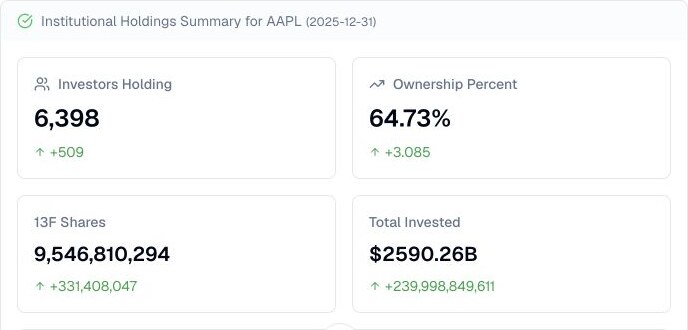
A quarter-specific ownership view
Choose the reporting year and quarter explicitly. The tool returns one summary for that request; it does not discover the latest available quarter or supply a time series. Request another period separately to compare the same stock and coverage.
The view summarizes reported filings, not every trade or the current portfolio of every institution. Use it to identify what changed and where to read the underlying 13F filings, amendments, manager disclosures, and market context.
Use cases
Review the number of holders, ownership percentage, 13F shares, and total invested value to frame how broadly institutions report exposure to the stock.
Compare new, increased, closed, and reduced position counts alongside total shares. More managers increasing positions does not establish net buying in shares or dollars: a few large reductions may outweigh many small additions.
Use total calls, total puts, put/call ratio, and their changes as a secondary clue for follow-up research—not as a direct read of institutional conviction.
Prompt examples
FAQ
Start with the reported changes, then verify the quarter, filing coverage, manager identities, share counts, valuation timing, and options definitions before relying on a conclusion.
Open Finance AgentFor informational and research use only. No output is investment advice or a guarantee of future performance.