

Find where the market is paying attention
Surface the most actively traded names and identify the companies and exchanges behind tickers you may not recognize.
Pineify Finance Agent retrieves Financial Modeling Prep’s most-active list, with 10 results by default and up to 50. Cards show ticker, company, exchange, price, absolute change, and percentage change. Use the provider’s volume-based shortlist to select research subjects; the cards do not show volume counts or quote timestamps.
Opens Finance Agent with a most-active-stocks question ready to send.
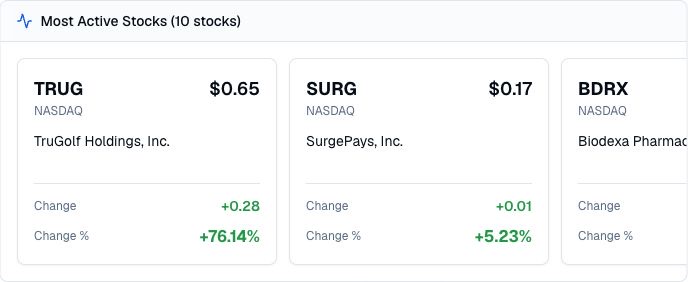
Market-attention discovery
The tool accepts a result limit and preserves the provider’s order. It has no historical date, exchange, sector, or ticker filter and no pagination. A high position on a volume-based list does not establish that volume is unusually high relative to that stock’s own history.
Use the ranking to decide where to investigate, not what to buy or sell. Heavy activity can accompany gains, losses, news, speculation, rebalancing, earnings, or changing liquidity, and the result does not explain which of those forces is responsible.
Use cases
Surface the most actively traded names and identify the companies and exchanges behind tickers you may not recognize.
Review price, absolute change, and percentage change to distinguish actively traded gainers from decliners without treating activity itself as a directional signal.
Use the list to choose which catalysts, filings, news events, liquidity conditions, fundamentals, and security types deserve closer examination.
Prompt examples
FAQ
Start with the names drawing the most trading attention, then investigate the catalyst, instrument type, liquidity, fundamentals, and risks behind the activity.
Open Finance AgentFor informational and research use only. No output is investment advice or a guarantee of future performance.