

Trace daily share changes
Review sessions with reported share increases or decreases and see the date and event context for each observation.
Pineify Finance Agent can organize an ETF’s flow history with share change, premium change, close price, trading volume, market date, and event context. Use it to see when shares were added or removed and to frame fund-flow research, while remembering that flow is not the same as investor direction, performance, or a forecast of the ETF price.
Opens Finance Agent with an ETF inflow and outflow research question ready to send.
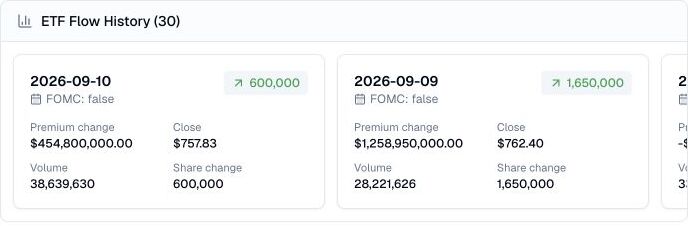
A dated view of ETF share creation and redemption
ETF flow adds a useful layer to market research: it shows whether reported shares increased or decreased and how that change sat alongside price, volume, and premium value. Finance Agent presents those observations in a dated history for an ETF such as SPY.
ETF shares are created and redeemed through authorized participants. Ordinary exchange trading transfers existing shares between buyers and sellers; it does not itself create fund shares. Arbitrage and hedging can connect these markets, so a share-count change does not establish end-investor intent.
Use cases
Review sessions with reported share increases or decreases and see the date and event context for each observation.
Put share change, premium change, close price, and volume side by side to identify periods worth investigating.
Use an unusual inflow or outflow as a lead for checking ETF holdings, sector exposure, macro events, and market liquidity.
Prompt examples
FAQ
Compare share changes with price, volume, composition, and market events before interpreting a day of inflow or outflow.
Open Finance AgentFor informational and research use only. No output is investment advice or a guarantee of future performance.