

Trace the profit path
Follow revenue through gross profit, operating expenses, operating income, taxes, net income, and earnings per share without losing the connection between each stage.
Pineify Finance Agent turns FMP’s standardized income-statement data into a clear period-by-period view of revenue, costs, operating profit, net income, margins, and earnings per share. Use it to see where profitability is changing, compare fiscal periods, and decide which filings, business drivers, or accounting details deserve a closer look.
Opens Finance Agent with an Apple annual income-statement question ready to send.
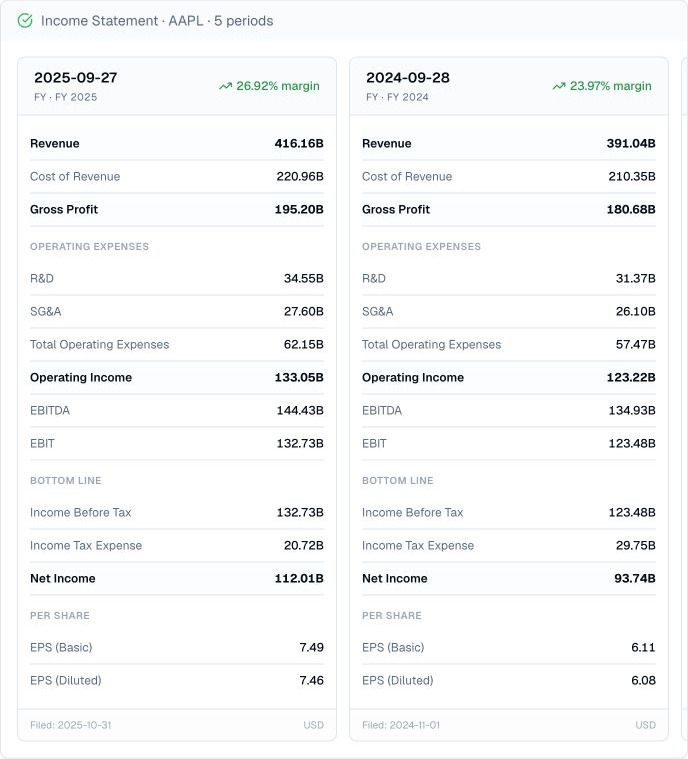
A structured profit view
An income statement follows the path from sales to earnings. By keeping revenue, gross profit, operating expenses, operating income, taxes, net income, margins, and earnings per share together, Finance Agent makes it easier to see which reported line items changed.
The view is a research starting point. Fiscal calendars, accounting policies, one-time items, acquisitions, restatements, currencies, and share-count changes can affect comparisons, so important conclusions should be checked against the company’s filings and notes.
Use cases
Follow revenue through gross profit, operating expenses, operating income, taxes, net income, and earnings per share without losing the connection between each stage.
See how sales, costs, research spending, overhead, margins, taxes, and per-share earnings changed across fiscal years or quarters.
Turn material changes into focused questions about pricing, volume, cost structure, operating leverage, dilution, one-time items, segments, and cash conversion.
Prompt examples
FAQ
Compare the periods, then confirm the filing, accounting policies, one-time items, cash conversion, balance-sheet effects, and segment drivers before drawing a conclusion.
Open Finance AgentFor informational and research use only. No output is investment advice or a guarantee of future performance.