

See the recommendation mix
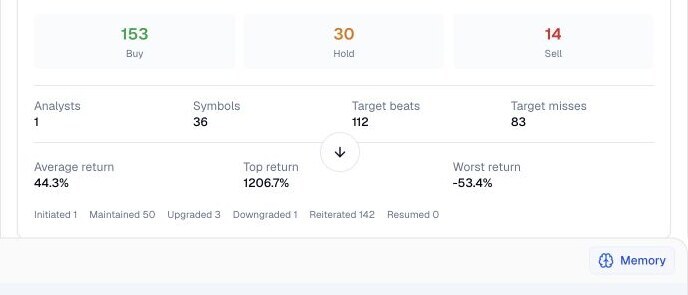
Compare Buy, Hold, and Sell counts with the number of covered stocks to understand whether the available views cluster or spread across companies.
Pineify Finance Agent retrieves a dated summary for one analyst identified by their TipRanks profile identifier. It shows recommendation counts, covered-stock count, actions, and provider target-comparison statistics. Resolve the analyst’s identity first, then specify a date window. The result contains aggregates rather than individual calls, source notes, or a simulated trading record.
Opens Finance Agent with a named-analyst performance question ready to send.
A one-analyst research view
Start with the analyst’s exact profile identifier from the directory or a rating record; the summary cannot resolve a name by itself. Ask for explicit start and end dates, or use the provider’s default trailing twelve months. Comparing two periods requires two separate summaries.
The summary is a research map, not a scorecard that can be separated from its definitions. The measurement window, covered stocks, target comparisons, and return methodology determine what the aggregate means, so use it to decide which original notes and company facts to verify next.
Use cases
Compare Buy, Hold, and Sell counts with the number of covered stocks to understand whether the available views cluster or spread across companies.
Compare counts of initiations, maintenance, upgrades, downgrades, reiterations, and resumptions. The aggregate does not show the sequence of changes or which stock produced each action.
Use target beats and misses plus average, maximum, and minimum provider return fields to choose which dated recommendations need deeper source and methodology checks.
Prompt examples
FAQ
Use the aggregate to find patterns, then inspect dated calls, source notes, target definitions, and current company evidence before making a decision.
Open Finance AgentFor informational and research use only. No output is investment advice or a guarantee of future performance.