

Rank companies by equity size
Place several tickers in one comparable view and quickly identify the largest and smallest market capitalizations in the selected group.
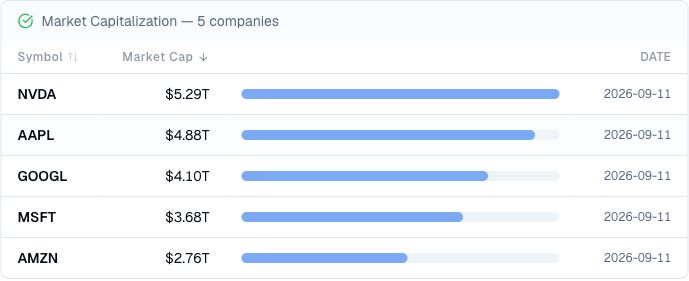
Pineify Finance Agent can compare the market capitalizations of several public companies in one view, rank them by equity size, visualize their relative scale, and preserve the date attached to each figure. Use it to establish company-size context before comparing financial performance, valuation, or competitive position.
Opens Finance Agent with a five-company market-cap comparison ready to send.
Company scale in one view
A side-by-side view makes it easier to see both the ordering and the distance between companies. Finance Agent can keep each ticker, market-cap figure, relative bar, and observation date together so the comparison remains easy to inspect.
Market capitalization is a point-in-time measure of publicly traded equity value. It changes with share price and shares outstanding, and it does not by itself describe debt, cash, operating performance, intrinsic value, or whether a stock is attractively priced.
Use cases
Place several tickers in one comparable view and quickly identify the largest and smallest market capitalizations in the selected group.
Use proportional bars alongside the figures to see whether companies are close in size or separated by a substantial market-value gap.
Use company size as an initial reference point before comparing growth, profitability, leverage, business mix, or valuation multiples.
Prompt examples
FAQ
Start with the market-cap gap, then compare revenue, cash flow, debt, enterprise value, share count, and valuation multiples before drawing a broader conclusion.
Open Finance AgentFor informational and research use only. No output is investment advice or a guarantee of future performance.