

Read the latest valuation and returns together
Review market cap, enterprise value, EV-based multiples, ROA, ROE, ROIC, ROCE, earnings yield, and free-cash-flow yield against the company’s most recent rolling performance.
Pineify Finance Agent brings a company’s latest rolling twelve-month metrics into one research view, connecting valuation, profitability, liquidity, operating efficiency, cash conversion, leverage, capital allocation, and free-cash-flow indicators. Use it to understand the current operating picture between annual reports, spot changes that warrant investigation, and decide which quarterly disclosures or definitions to verify next.
Opens Finance Agent with an Apple trailing-twelve-month metrics question ready to send.
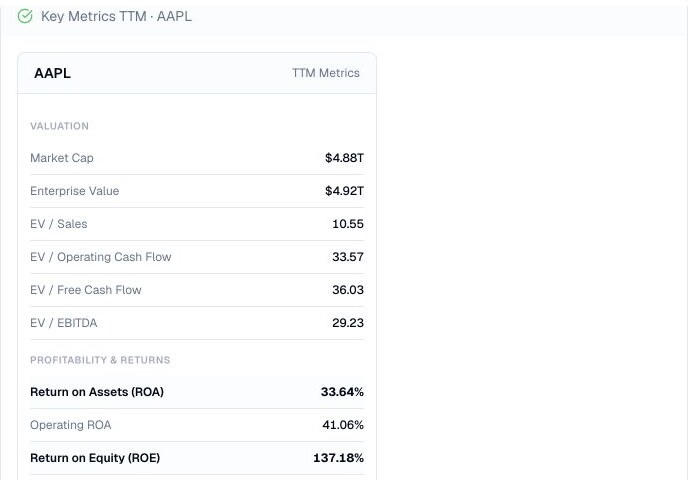
A current operating snapshot
Trailing-twelve-month flow measures can combine four consecutive quarters. Ratios must be calculated from the appropriate underlying inputs; balance-sheet amounts are point-in-time or average balances, not four-quarter sums. Finance Agent retrieves FMP key metrics for one ticker and displays the provider values. This query has no date, period, history or pagination input; it does not reconstruct a historical TTM series or calculate the metrics from filings.
TTM is a time basis, not a promise of live or forward-looking information. The window can mix different seasons and may change as a new quarter replaces the oldest one. Treat the result as a research starting point, then trace important changes to the underlying quarterly disclosures and definitions.
Use cases
Review market cap, enterprise value, EV-based multiples, ROA, ROE, ROIC, ROCE, earnings yield, and free-cash-flow yield against the company’s most recent rolling performance.
Use current ratio, working capital, days sales outstanding, days inventory, days payables, operating cycle, and cash conversion cycle to frame questions about the latest operating rhythm.
Connect net debt to EBITDA, tax and interest burden, capital spending, free cash flow to equity and the firm, tangible asset value, and average balance measures before opening the quarterly filings.
Prompt examples
FAQ
Start with the latest twelve-month pattern, then confirm the contributing quarters, dates, formulas, units, market-data timing, and unusual items before relying on a comparison.
Open Finance AgentFor informational and research use only. No output is investment advice or a guarantee of future performance.