

Discover the strongest downside movers
See which tickers are leading the losers list and identify the names and exchanges behind symbols you may not recognize.
Pineify Finance Agent retrieves Financial Modeling Prep’s biggest-losers list and returns the first 10 records by default, up to 50. Cards show ticker, security name, exchange, price, absolute change, and percentage change. AI helps request and interpret this snapshot; it does not forecast a rebound or generate the ranking.
Opens Finance Agent with a top-stock-losers question ready to send.
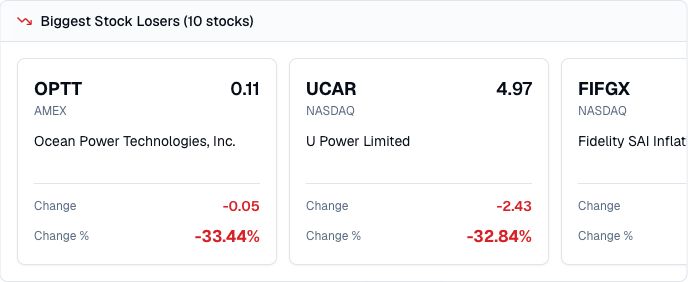
Downside-mover discovery
Choose a result limit, then compare the reported price changes within that returned set. The tool preserves provider order and has no exchange, session, date, or minimum-volume filter. It cannot recover historical losers lists for a requested past day.
Use the list as an investigation queue, not as a bargain list. A large percentage decline can reflect material news, low liquidity, a very low starting price, a corporate action, or a different security type, so the instrument and cause still need to be checked.
Use cases
See which tickers are leading the losers list and identify the names and exchanges behind symbols you may not recognize.
Review price, absolute change, and percentage change together so a large percentage loss in a low-priced security is not mistaken for the largest dollar decline.
Use the ranking to prioritize follow-up research into news catalysts, filings, trading volume, liquidity, company fundamentals, and security type.
Prompt examples
FAQ
Start with the sharpest declines, then investigate the catalyst, instrument type, liquidity, fundamentals, and risks behind the names that stand out.
Open Finance AgentFor informational and research use only. No output is investment advice or a guarantee of future performance.