

Compare revenue and profit momentum
See whether gross profit, operating income, and net income are growing faster or slower than revenue across the same reported periods.
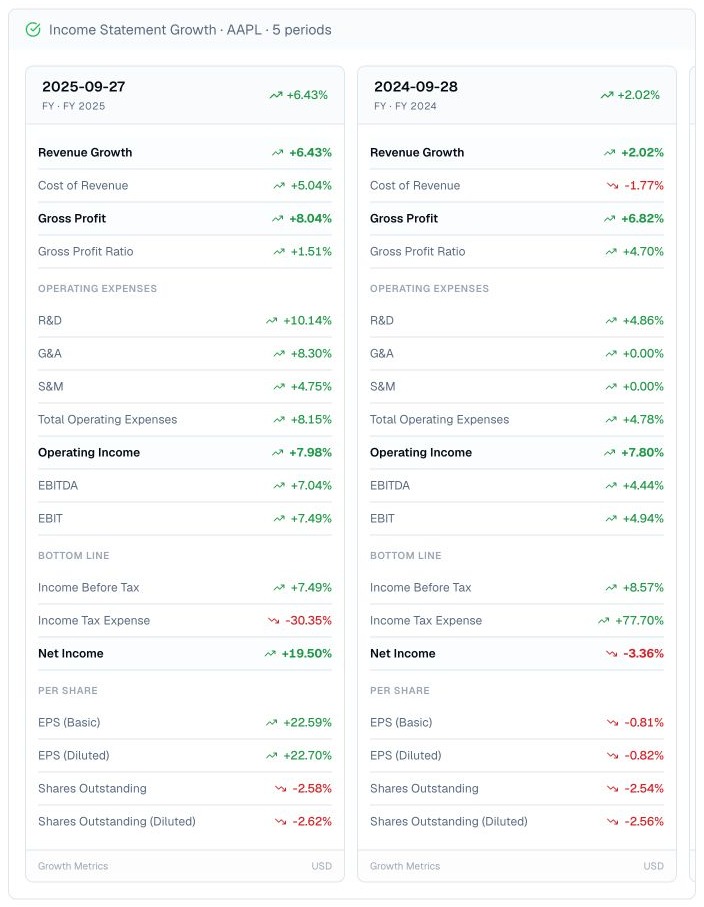
Pineify Finance Agent retrieves FMP’s income-statement growth measures for annual or quarterly periods and displays the supplied rates as percentages. Use it to see whether revenue, gross profit, operating income, net income, earnings per share, expenses, and share counts are moving together, then trace important gaps back to the underlying statements and filings.
Opens Finance Agent with an Apple annual income-statement growth question ready to send.
A connected growth view
A growth view keeps revenue, cost of revenue, gross profit, operating expenses, operating income, net income, earnings per share, and share-count changes in the same period context. That makes it easier to see whether profit is scaling faster or slower than sales and where the difference may be coming from.
Growth rates describe change, not business quality by themselves. A small prior-period base, a loss, a reclassification, an acquisition, currency movement, or a one-time tax item can make a percentage look unusually large or directionally misleading.
Use cases
See whether gross profit, operating income, and net income are growing faster or slower than revenue across the same reported periods.
Compare cost of revenue, research spending, administrative costs, selling expense, and total operating expenses with top-line growth.
Review net-income growth beside basic and diluted earnings-per-share growth and changes in weighted average shares to identify possible buyback or dilution effects.
Prompt examples
FAQ
Identify the line items moving differently, then confirm the comparison period, reported values, accounting changes, one-time items, currency effects, and cash-flow implications.
Open Finance AgentFor informational and research use only. No output is investment advice or a guarantee of future performance.