

Compare fund economics
Review NAV, assets under management, expense ratio, and average volume to understand a fund’s scale, cost, and trading context.
Pineify Finance Agent creates a quick profile for an ETF or mutual fund: what it tracks, who manages it, its NAV, assets under management, expense ratio, inception date, number of holdings, average volume, and sector exposure. Use the overview to compare fund structure and exposure, then confirm the official prospectus and current holdings before making an investment decision.
Opens Finance Agent with an SPY ETF overview question ready to send.
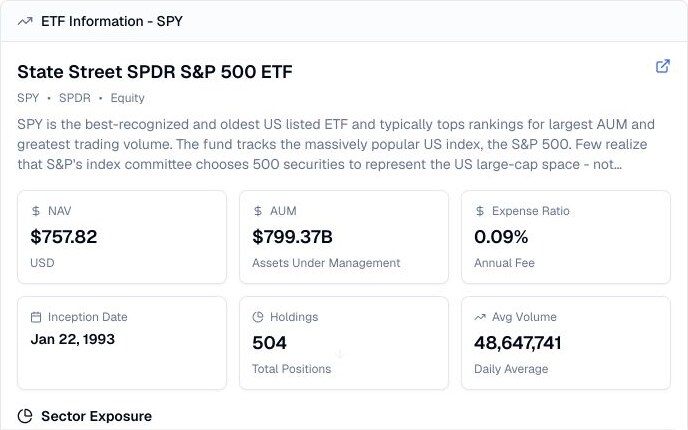
A fund profile in one view
Two funds can follow a similar theme while differing materially in fees, size, liquidity, age, number of holdings, and sector exposure. Finance Agent brings those comparison points together before you spend time on performance charts.
The profile retrieves one available fund record for the ticker. It includes a source update time, but no separate observation date for every metric. Use it to identify differences, then check the official documents for current definitions and missing context.
Use cases
Review NAV, assets under management, expense ratio, and average volume to understand a fund’s scale, cost, and trading context.
See the provider, asset class, inception date, domicile, trading status, and holdings count. Active refers to the supplied trading-status flag; it does not mean the fund is actively managed.
Scan the sector mix to identify concentration and discover whether the fund’s actual exposure matches its name or theme.
Prompt examples
FAQ
Use the profile to narrow your research, then verify the prospectus, index methodology, fees, liquidity, holdings, and current market context.
Open Finance AgentFor informational and research use only. No output is investment advice or a guarantee of future performance.