MQL5 AI: Build MetaTrader 5 Expert Advisors Without Coding
· 12 min read
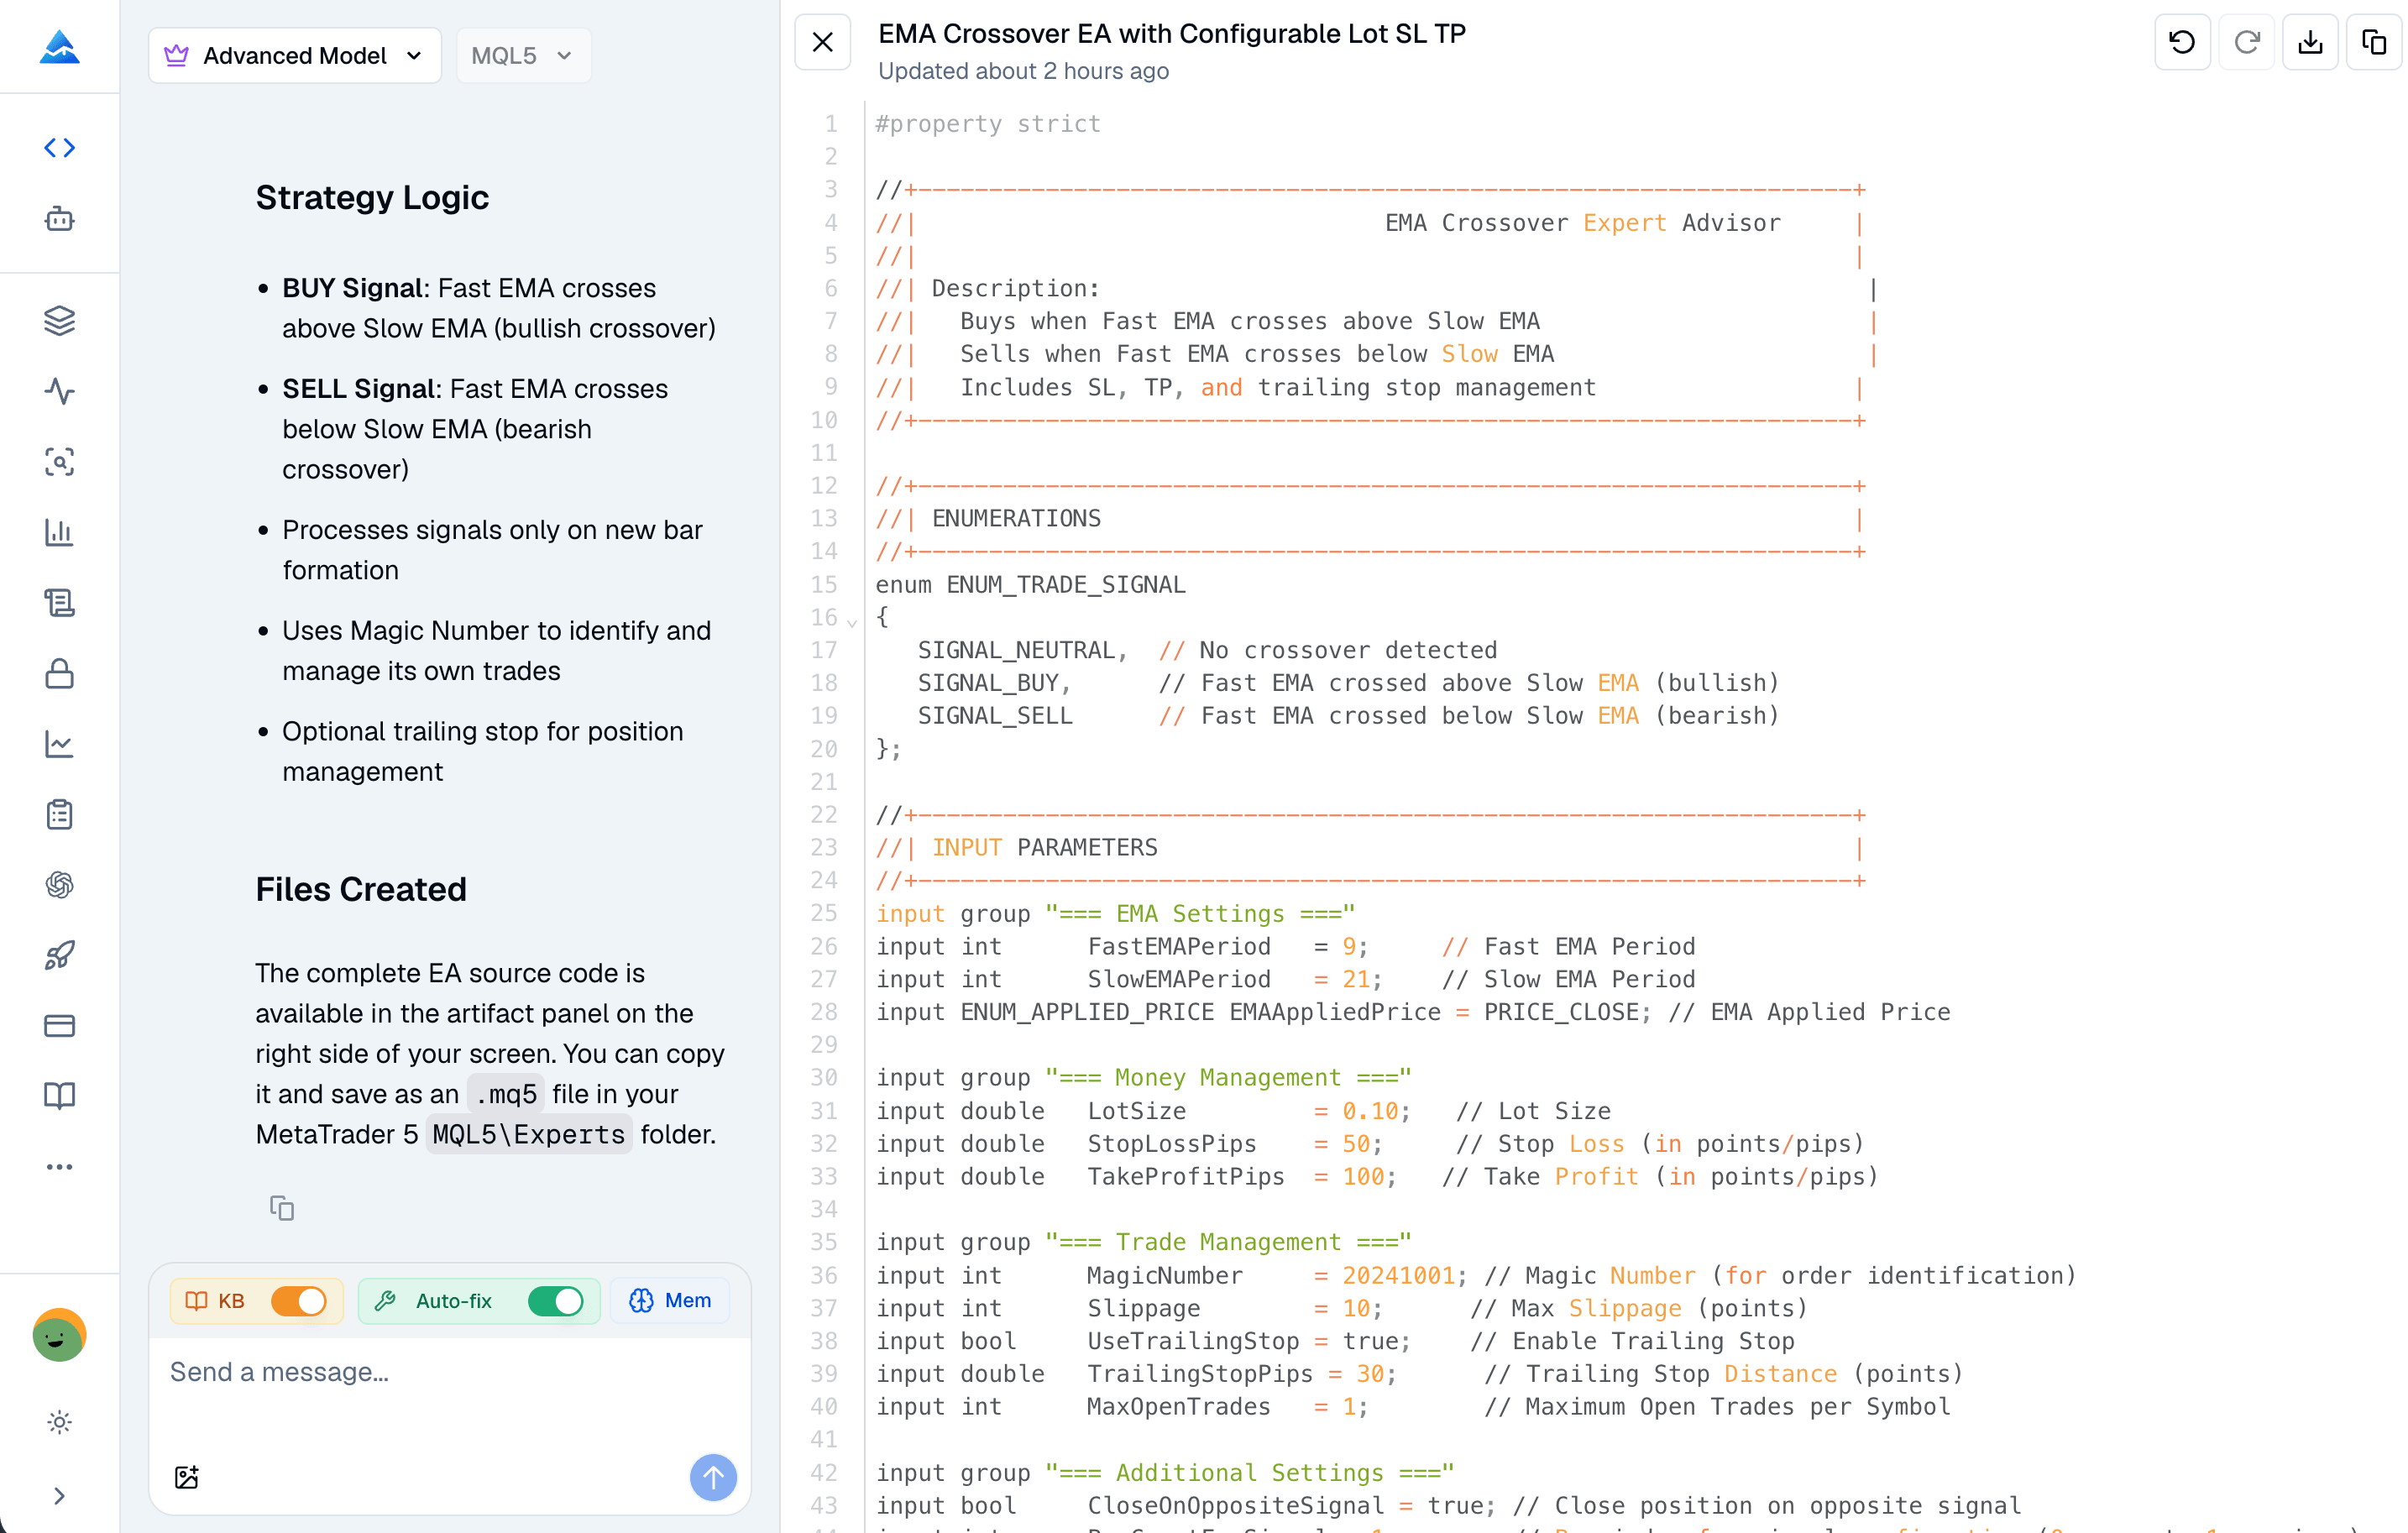
MQL5 AI is a specialized tool category that generates compilable MetaTrader 5 code from plain English strategy descriptions. If you've looked into algorithmic trading for MT5, you've probably seen these tools popping up. They handle MQL5 syntax, event handlers like OnInit() and OnTick(), buffer management, and MetaQuotes API rules — so you can build Expert Advisors, custom indicators, and scripts without being a coding expert. I've tested several options, and the difference between general chatbots and purpose-built MQL5 agents is huge.