52 Week High Low Indicator: Trade Annual Price Levels on TradingView
The 52 Week High Low indicator is a price tracking tool that marks the highest and lowest prices an asset has reached over the past year. It plots two horizontal lines on your chart, giving you instant reference points that institutional traders, retail investors, and algorithms all watch.
Ever wonder why certain price levels seem to act like invisible walls in the market? When a stock hits its yearly high, everyone who bought during the previous 52 weeks is sitting on profit. Some will take gains, creating natural selling pressure. When price approaches the annual low, value hunters often step in, believing they're getting a bargain. These aren't random levels — they're zones where real money changes hands.
Why the 52 Week High Low Indicator Actually Matters
Before getting into the technical setup, let's talk about why this indicator deserves a spot on your charts. Unlike complex oscillators that give conflicting signals, the 52-week high and low levels are crystal clear. Price is either approaching these levels or it isn't.
Psychological Anchoring: Human psychology plays a huge role in markets. Traders remember significant price levels, especially yearly highs and lows. This collective memory creates predictable behavior patterns around these zones.
Institutional Reference Points: Large funds and institutions use these levels for position sizing and risk management. When you're trading the same levels as the big players, you're swimming with the current.
Breakout Confirmation: When price breaks above a 52-week high or below a 52-week low, it often signals the start of significant moves. These breakouts tend to have more follow-through than breaks of shorter-term levels.
How to Add the 52 Week High Low Indicator to Your TradingView Charts

Getting this indicator on your charts is straightforward. With Pineify's visual editor, you don't need to write a single line of code:
- Open the Editor: Go to Pineify and launch the visual Pine Script editor
- Search: Find "52 Week High Low" in the indicator library
- Configure: Adjust colors, line styles, and the lookback period
- Generate: Let Pineify create the Pine Script code automatically
- Deploy: Copy the code and paste it into TradingView's Pine Script editor
- Apply: Save and apply the indicator to start tracking annual levels
Why Go No-Code? I've written plenty of Pine Script manually, and it's frustrating when a missing semicolon or version mismatch kills an hour of work. Pineify generates clean, tested code that works immediately. And if you want to tweak settings later, you don't need to dig through code — just adjust the visual controls.
If you're exploring other useful tools, check out our free TradingView indicators guide to round out your analysis.

The Pine Script Formula Behind the Indicator
The calculation is dead simple:
- 52 Week High =
highest(high, 252)— the highest price over 252 trading days - 52 Week Low =
lowest(low, 252)— the lowest price over 252 trading days
That's it. The number 252 represents the standard trading days in a year. For crypto markets, you'd change this to 365 since crypto trades 24/7.
How to Read and Trade the 52 Week High Low Indicator
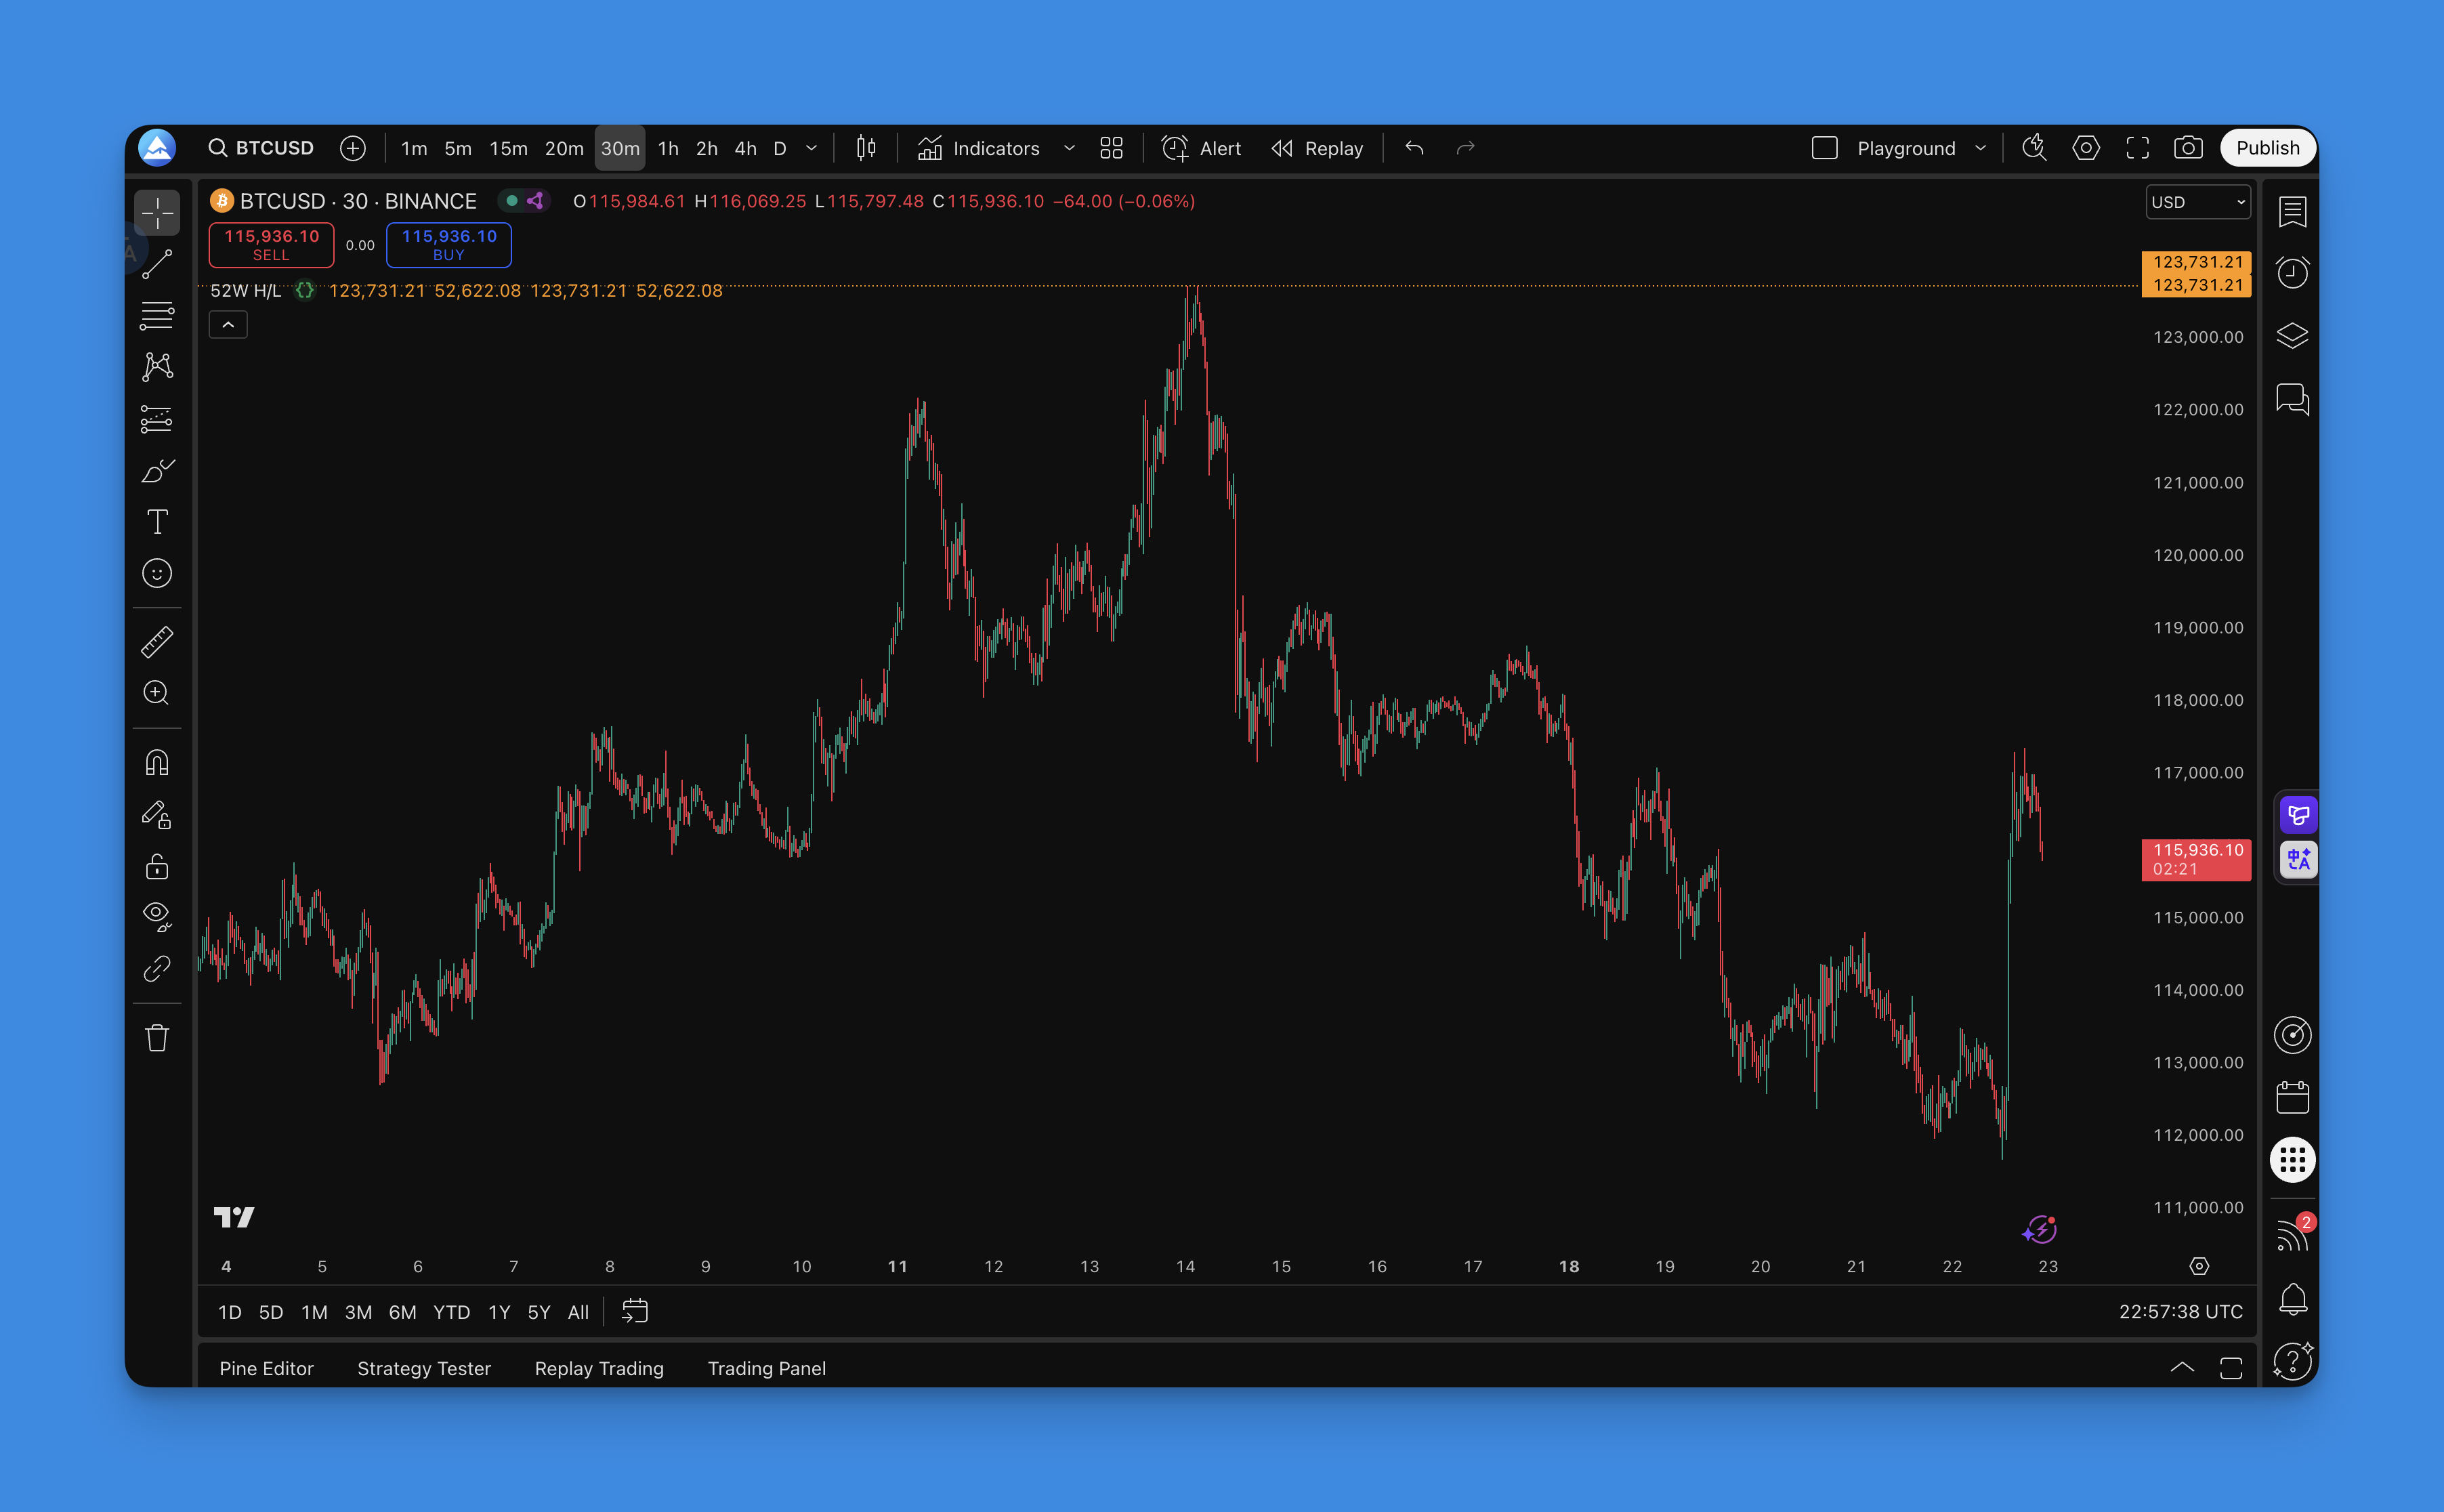
Once the indicator is on your chart, you'll see two horizontal lines extending across your entire chart. These aren't random — they represent where bulls and bears have fought their hardest battles over the past year.
The 52-Week High Line: Marks the highest price in the last 52 weeks. Think of it as the ceiling price has struggled to break through.
The 52-Week Low Line: Shows the lowest point during the same period — the floor where buyers have historically stepped in.
Trading the Resistance Zone (52-Week High)
When price climbs toward that yearly high, here's what I watch for:
Rejection Signals: Long upper wicks, shooting star patterns, or volume spikes without follow-through. These often mean sellers are defending the level.
Profit-Taking Opportunities: If you're already long, consider scaling out as price approaches this level. I've seen AAPL reject its 52-week high three times in April 2025 before breaking through on heavy volume. The traders who took partial profits on those rejections came out ahead.
Breakout Preparation: Don't assume the level will hold. If price breaks above with strong volume, it often leads to significant upward moves.
Trading the Support Zone (52-Week Low)
The yearly low acts as a psychological support level where value investors emerge:
Bounce Patterns: Hammer candles, bullish engulfing patterns, or divergence with momentum indicators can signal potential reversals.
Volume Analysis: Heavy volume near the 52-week low often signals institutional interest. I haven't tested this on penny stocks, but on SPY and QQQ it's been reliable.
Risk Management: These levels can break. I prefer setting stops 2% below the 52-week low and risking no more than 1% of account per trade.
Timeframe Flexibility
| Timeframe | Best Use Case |
|---|---|
| Daily | Swing trading — gives clean entries and exits |
| 4-hour | Position trades — tighter levels for quicker moves |
| 1-hour | Day trading — useful for intraday bounces off annual levels |
The key is maintaining the weekly calculation regardless of your display timeframe. That preserves the psychological significance of these annual levels.
Breakout Trading
Above 52-Week High: These breakouts tend to have strong follow-through because they attract momentum traders and trigger algorithmic buying. Enter on the breakout with a stop below the previous high.
Below 52-Week Low: Breakdown below yearly lows can signal significant weakness. Respect the momentum and check the broader market context before shorting.
Range-Bound Trading
When price oscillates between the yearly high and low:
- Buy near the 52-week low with targets toward the 52-week high
- Sell or short near the 52-week high with targets toward the 52-week low
- Always check the overall market trend and sector rotation
For additional confirmation around these levels, you might want to explore Bollinger Bands combined with RSI as a secondary filter.
Optimal Settings for Maximum Effectiveness
The beauty of this indicator is its simplicity, but getting the settings right prevents chart clutter.
Core Configuration
Lookback Period: 252 trading days works for most assets. Consider adjusting for:
- Crypto markets: 365 days (24/7 trading)
- Forex pairs: 252 days (traditional trading calendar)
- Shorter analysis: 126 days (6 months) for more responsive levels
Visual Optimization
Line Styling:
- Color: Orange (RGB: 255, 152, 0) works well on light and dark themes
- Line Width: 2-3 pixels for visibility without overwhelming the chart
- Line Style: Solid by default, but I'll use dashed when I overlay multiple indicators
Chart Integration:
- Enable price tracking to see exact levels on the right axis
- Extend lines across the entire chart for historical context
- Use 10-20% transparency if you have multiple indicators running
Multi-Asset Notes
- Stocks: Standard 52-week settings work well
- ETFs: Consider 40-week periods to account for different volatility patterns
- Commodities: 52-week works, but watch for seasonal patterns that might need adjustment
Backtesting Your 52-Week High Low Strategy
Before risking real money, backtest your approach. Here's how I set up a proper evaluation.
Setup
Data Range: Use at least 3-5 years to capture different market cycles. I tested my breakout strategy on TSLA from 2022-2025 — the mean reversion setup near the 52-week low worked well in sideways markets but failed during the 2024 downtrend.
Transaction Costs: Include 0.1-0.3% per trade for realistic spreads and slippage.
Defining Rules
Breakout Strategy:
- Entry: Buy when price closes above 52-week high with volume confirmation
- Exit: Sell when price closes below 20-period EMA or hits a 10-15% profit target
- Stop Loss: 3-5% below entry
- Position Size: Risk 1-2% of account per trade
Mean Reversion Strategy:
- Entry: Buy when price touches 52-week low with RSI below 30
- Exit: Sell when price reaches 50% of the 52-week range or RSI exceeds 70
- Stop Loss: 2% below 52-week low
- Position Size: Risk 1% of account per trade
Metrics to Track
Performance: total return, win rate (40%+ for breakout, 60%+ for mean reversion), profit factor (1.5+), average win vs loss ratio (2:1 or better)
Risk: maximum drawdown (under 15-20%), Sharpe ratio (above 1.0), consecutive losses
Red Flags
Watch out for 80%+ win rates or 50%+ annual returns — those usually mean curve fitting. Also check for inconsistent performance across different years and parameter sensitivity.
For more sophisticated backtesting approaches, explore AI-powered Pine Script development to set up better testing frameworks.
Backtesting shows what could have happened, not what will happen. Use it as a guide.
The 52 Week High Low indicator isn't just another line on your chart. Markets evolve, but the psychological significance of annual price extremes stays relevant. When CNBC mentions a stock hitting new 52-week highs, every trader knows what that means. That shared understanding creates self-fulfilling behavior.
Is it perfect? No. It's a lagging tool based on past data. False breakouts happen, especially in low-volume or volatile markets. I wouldn't rely on it alone — combine it with volume analysis, price action, and proper risk management.
Add it to your charts, observe how price reacts, backtest a simple strategy, and keep position sizes small while you learn. No single indicator makes or breaks your trading, but understanding these key psychological levels gets you closer to consistent decisions.
Frequently Asked Questions
▶What is the 52 Week High Low indicator in TradingView?
The 52 Week High Low indicator tracks the highest and lowest prices an asset has reached over the past 52 weeks (roughly 252 trading days). It draws two horizontal lines on your chart — the annual high as resistance and the annual low as support. Traders use it for breakout and range-bound strategies.
▶How do I add the 52 Week High Low indicator to my TradingView charts?
The quickest way is to use Pineify's visual editor. Search for "52 Week High Low" in the library, configure the colors and line style, generate the Pine Script, and paste it into TradingView's Pine Script editor. The indicator will display two horizontal lines marking the yearly high and low.
▶What is the ideal lookback period for the 52 Week High Low indicator?
252 trading days (52 weeks) works for most assets. For crypto markets trading 24/7, use 365 days. For shorter-term analysis, 126 days (26 weeks) gives more responsive levels. Keep it consistent once you pick a period so the levels stay meaningful.
▶Can the 52 Week High Low indicator be used for breakout trading?
Yes, it's particularly effective for breakouts. When price breaks above the 52-week high on strong volume, momentum traders and algorithms often pile in. A breakdown below the 52-week low can signal sustained weakness. Always confirm with volume and price action before acting.
▶How do I backtest a 52 Week High Low trading strategy?
Use TradingView's Strategy Tester with 3-5 years of data. Define clear entry rules — for example, buy when price closes above the 52-week high with volume confirmation. Set stops 3-5% below entry. Track win rate, profit factor, and maximum drawdown. Walk-forward analysis and Monte Carlo simulation give more reliable results.
▶What are the limitations of the 52 Week High Low indicator?
It's a lagging indicator based on past data. False breakouts happen, especially during low volume or high volatility. I don't use it alone — it works best as part of a broader system with proper risk management. No single tool should be your only reason to enter a trade.