Pineify Market Insights: Options Flow, Dark Pool & Congress Trades
Every day, over $500 billion in options premium changes hands across U.S. exchanges. Billions more flow through dark pools — private venues where institutions execute massive block trades away from public eyes. Meanwhile, 535 members of Congress buy and sell stocks with access to non-public information. Pineify Market Insights is a unified dashboard that pulls options flow, dark pool block trades, congressional disclosures, and net premium sentiment into one interface. I've used a lot of tracking tools over the years, and this is the first time I've seen all four streams in one place without juggling tabs.
Why Retail Traders Need Institutional Data
Hedge funds and prop desks have always seen more than retail. They know when large options orders hit, which dark pool levels attract institutional volume, and how net premium sentiment shifts across sectors — all in real time. Retail traders usually get delayed data, social media noise, or expensive standalone tools that cover one piece at a time. The result? A fragmented view that's always catching up.
Pineify Market Insights closes that gap. Four data streams, one interface:
| Module | What It Tracks | Why It Matters |
|---|---|---|
| Options Flow | Every large options trade in real time | Spot unusual activity and smart money positioning |
| Market Tide | Net call vs. put premium across the market | Gauge overall bullish/bearish sentiment |
| Dark Pool | Off-exchange institutional block trades | Find hidden support/resistance levels |
| Congress Trading | Stock trades by U.S. lawmakers | Detect political timing signals |
Options Flow: Follow the Smart Money
Options flow analysis is one of the most reliable ways to spot institutional positioning before price moves. When a hedge fund buys $5 million in call options on a stock, that order shows up in the options tape — and Pineify captures it instantly.
How Options Flow Tracking Works
Each options trade is classified by its execution price relative to the bid-ask spread:
- Above Ask: The buyer paid more than the ask — a sign of aggressive bullish conviction
- Below Bid: The seller accepted less than the bid — aggressive bearish positioning
- At Mid: Executed near the midpoint — often a negotiated institutional trade
I've seen this classification catch major moves. Back in October 2025, a $2.8M above-ask call sweep on META told me someone knew something before earnings. The stock jumped 7% the next day.
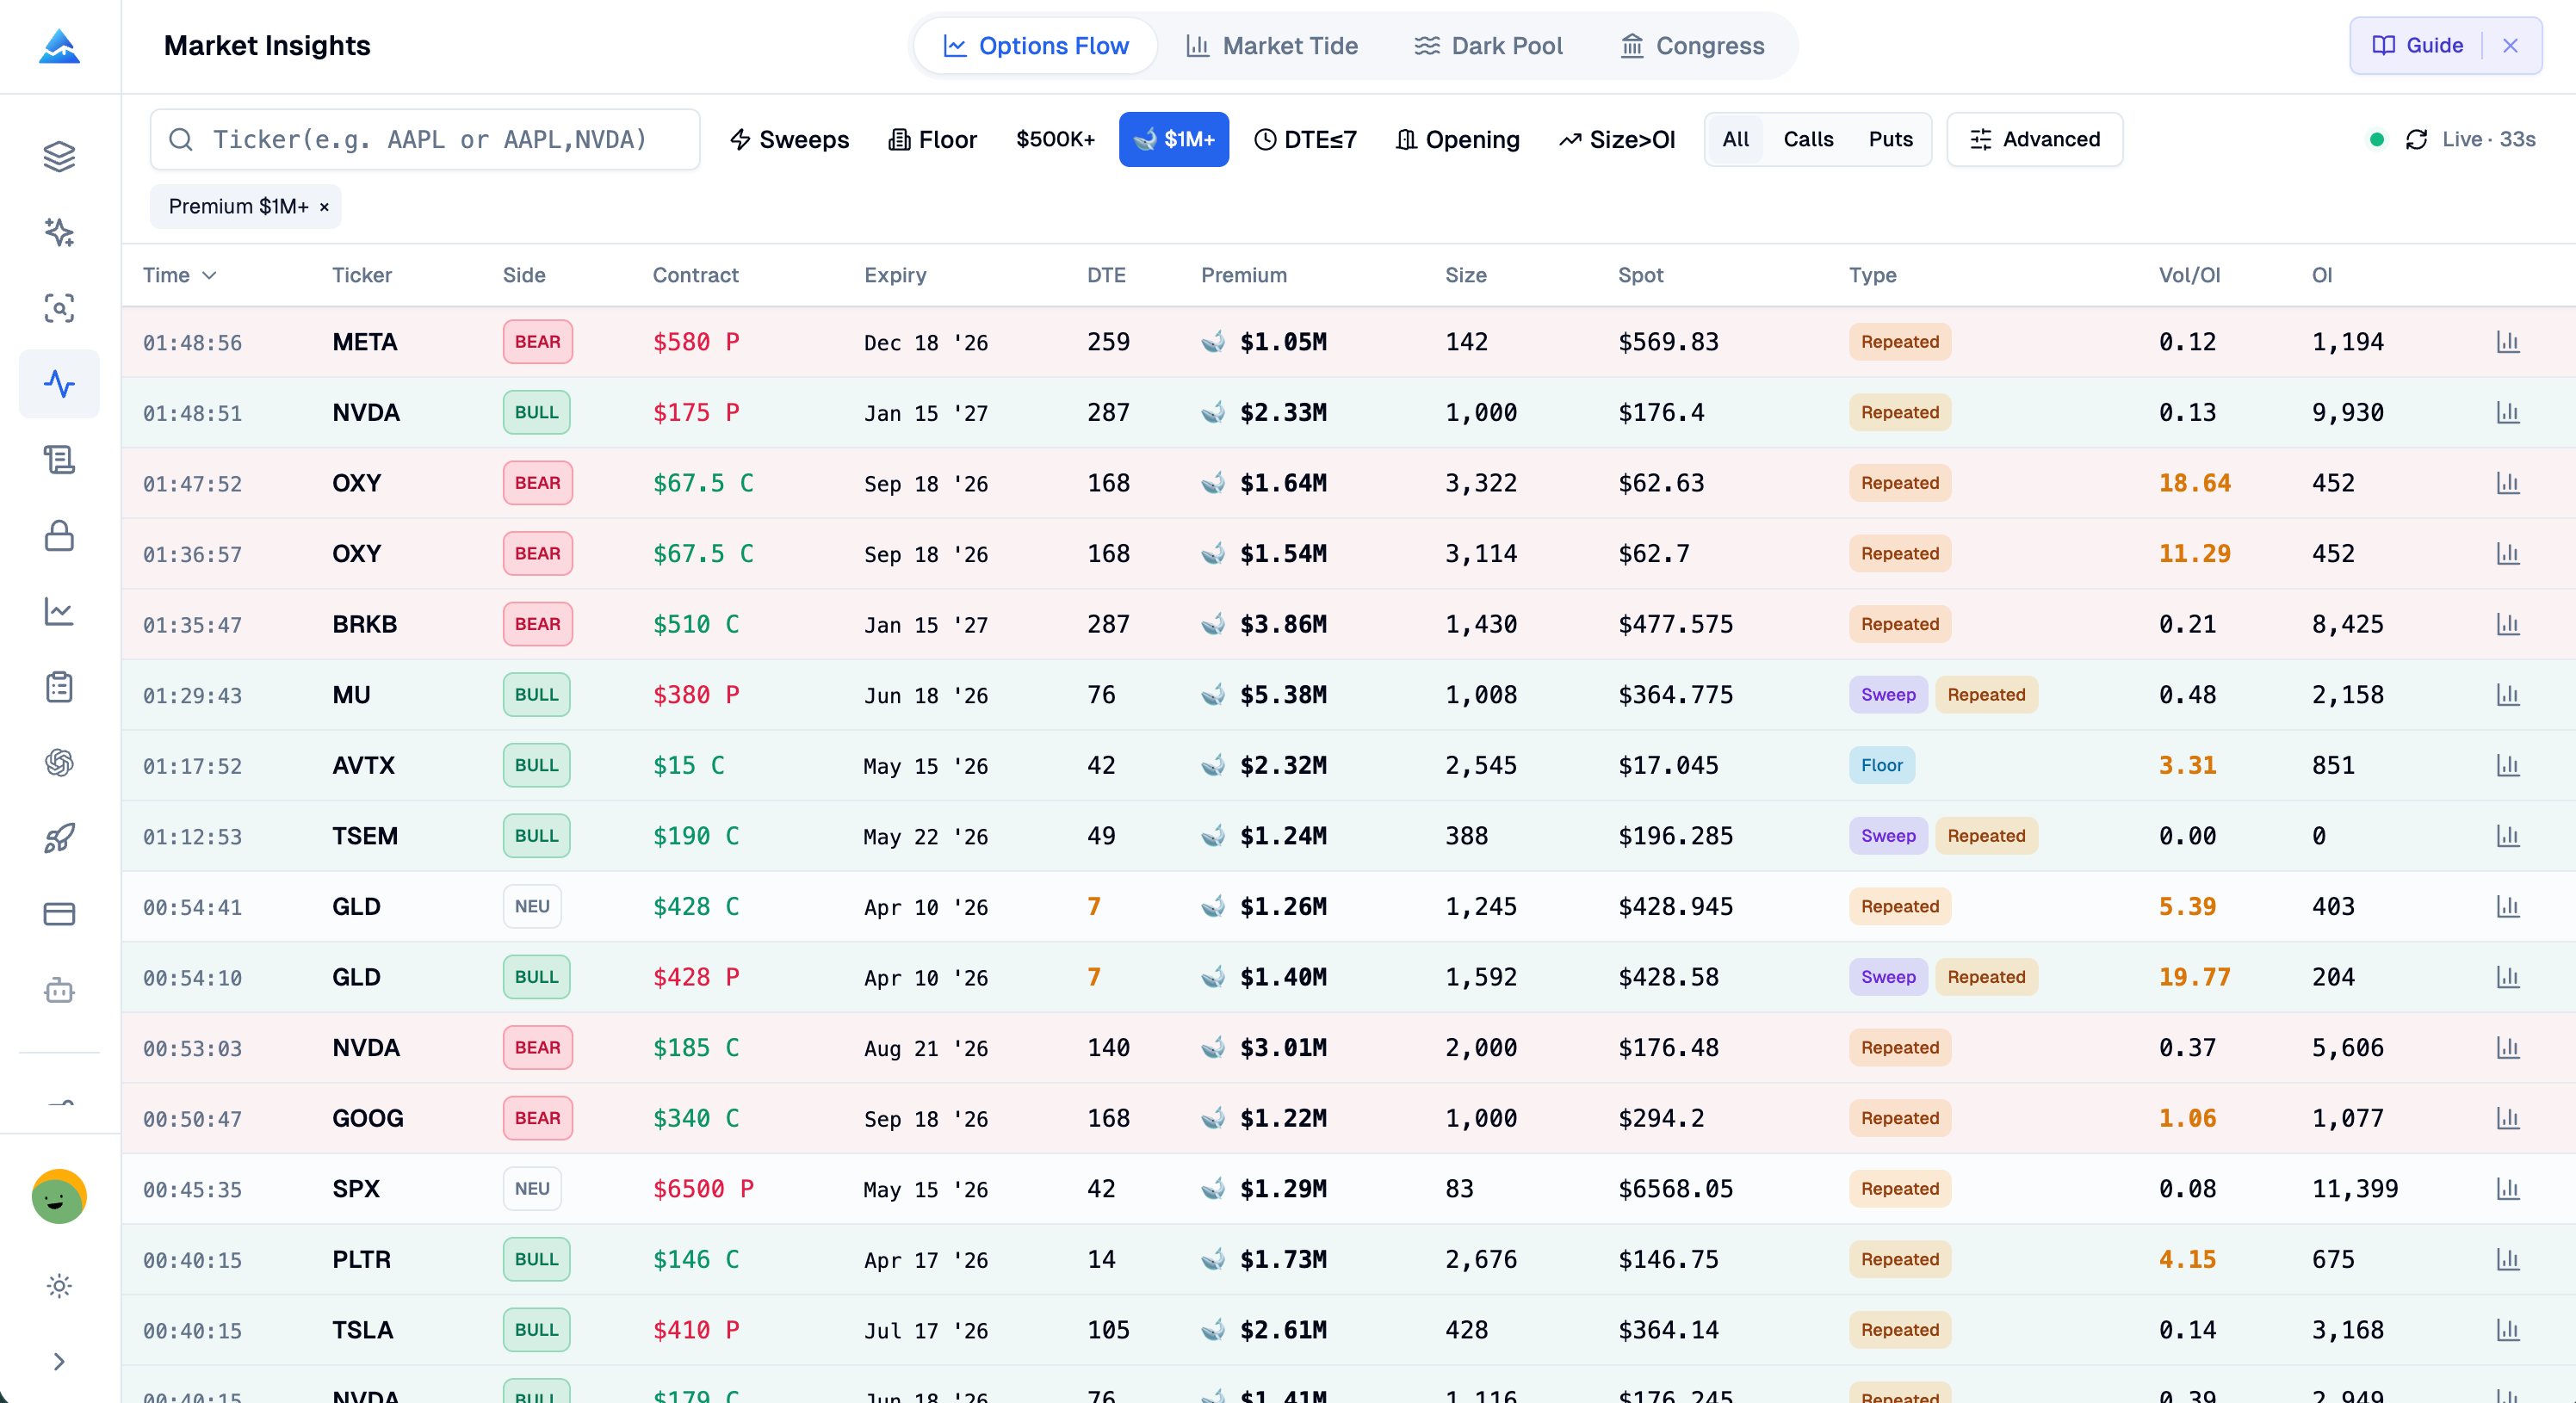
Key Features of Pineify's Options Flow Module
Unusual Activity Detection: Trades with premium above your threshold are flagged automatically. A $2M+ single-leg call purchase on a mid-cap stock? That's the kind of signal that precedes major moves.
Multi-Dimensional Filtering: Filter by ticker, minimum premium, sentiment (bullish/bearish/neutral), trade type (single, sweep, split), and expiration range. Build custom views that match your trading style.
Full Greeks Breakdown: Expand any trade to see Delta, Gamma, Theta, Vega, and implied volatility. Understand not just what was traded, but how the trader is positioned for time decay, volatility, and directional movement.
Real-Time Updates: Data streams during market hours with smart polling that pauses when you navigate away and resumes when you return — no wasted bandwidth, no stale data.
Practical Options Flow Strategies
Sweep Detection: When a large order is split across multiple exchanges simultaneously, it signals urgency. The buyer wants to fill the entire order before the market can react. Sweeps on out-of-the-money calls before earnings are a classic smart money tell.
Unusual Volume Ratio: Compare today's options volume to the 30-day average. A stock trading 5x its normal call volume with large premium? Something is happening that the broader market hasn't priced in yet.
Expiration Analysis: Short-dated options (weekly expiration) with large premium suggest the buyer expects a move this week. Longer-dated LEAPS purchases indicate a longer-term thesis.
Market Tide: Read the Room Before You Trade
Individual options trades tell you about specific stocks. Market Tide tells you about the entire market. It aggregates net call premium minus net put premium across all options activity to quantify whether the overall market is leaning bullish or bearish.
Net Premium: The Market's True Sentiment Indicator
Traditional sentiment indicators like the VIX or put/call ratio are useful but limited. The VIX measures expected volatility, not direction. The put/call ratio doesn't account for premium size. Net premium analysis is more precise. When institutions are aggressively buying calls and net premium turns sharply positive, it reflects real capital commitment.
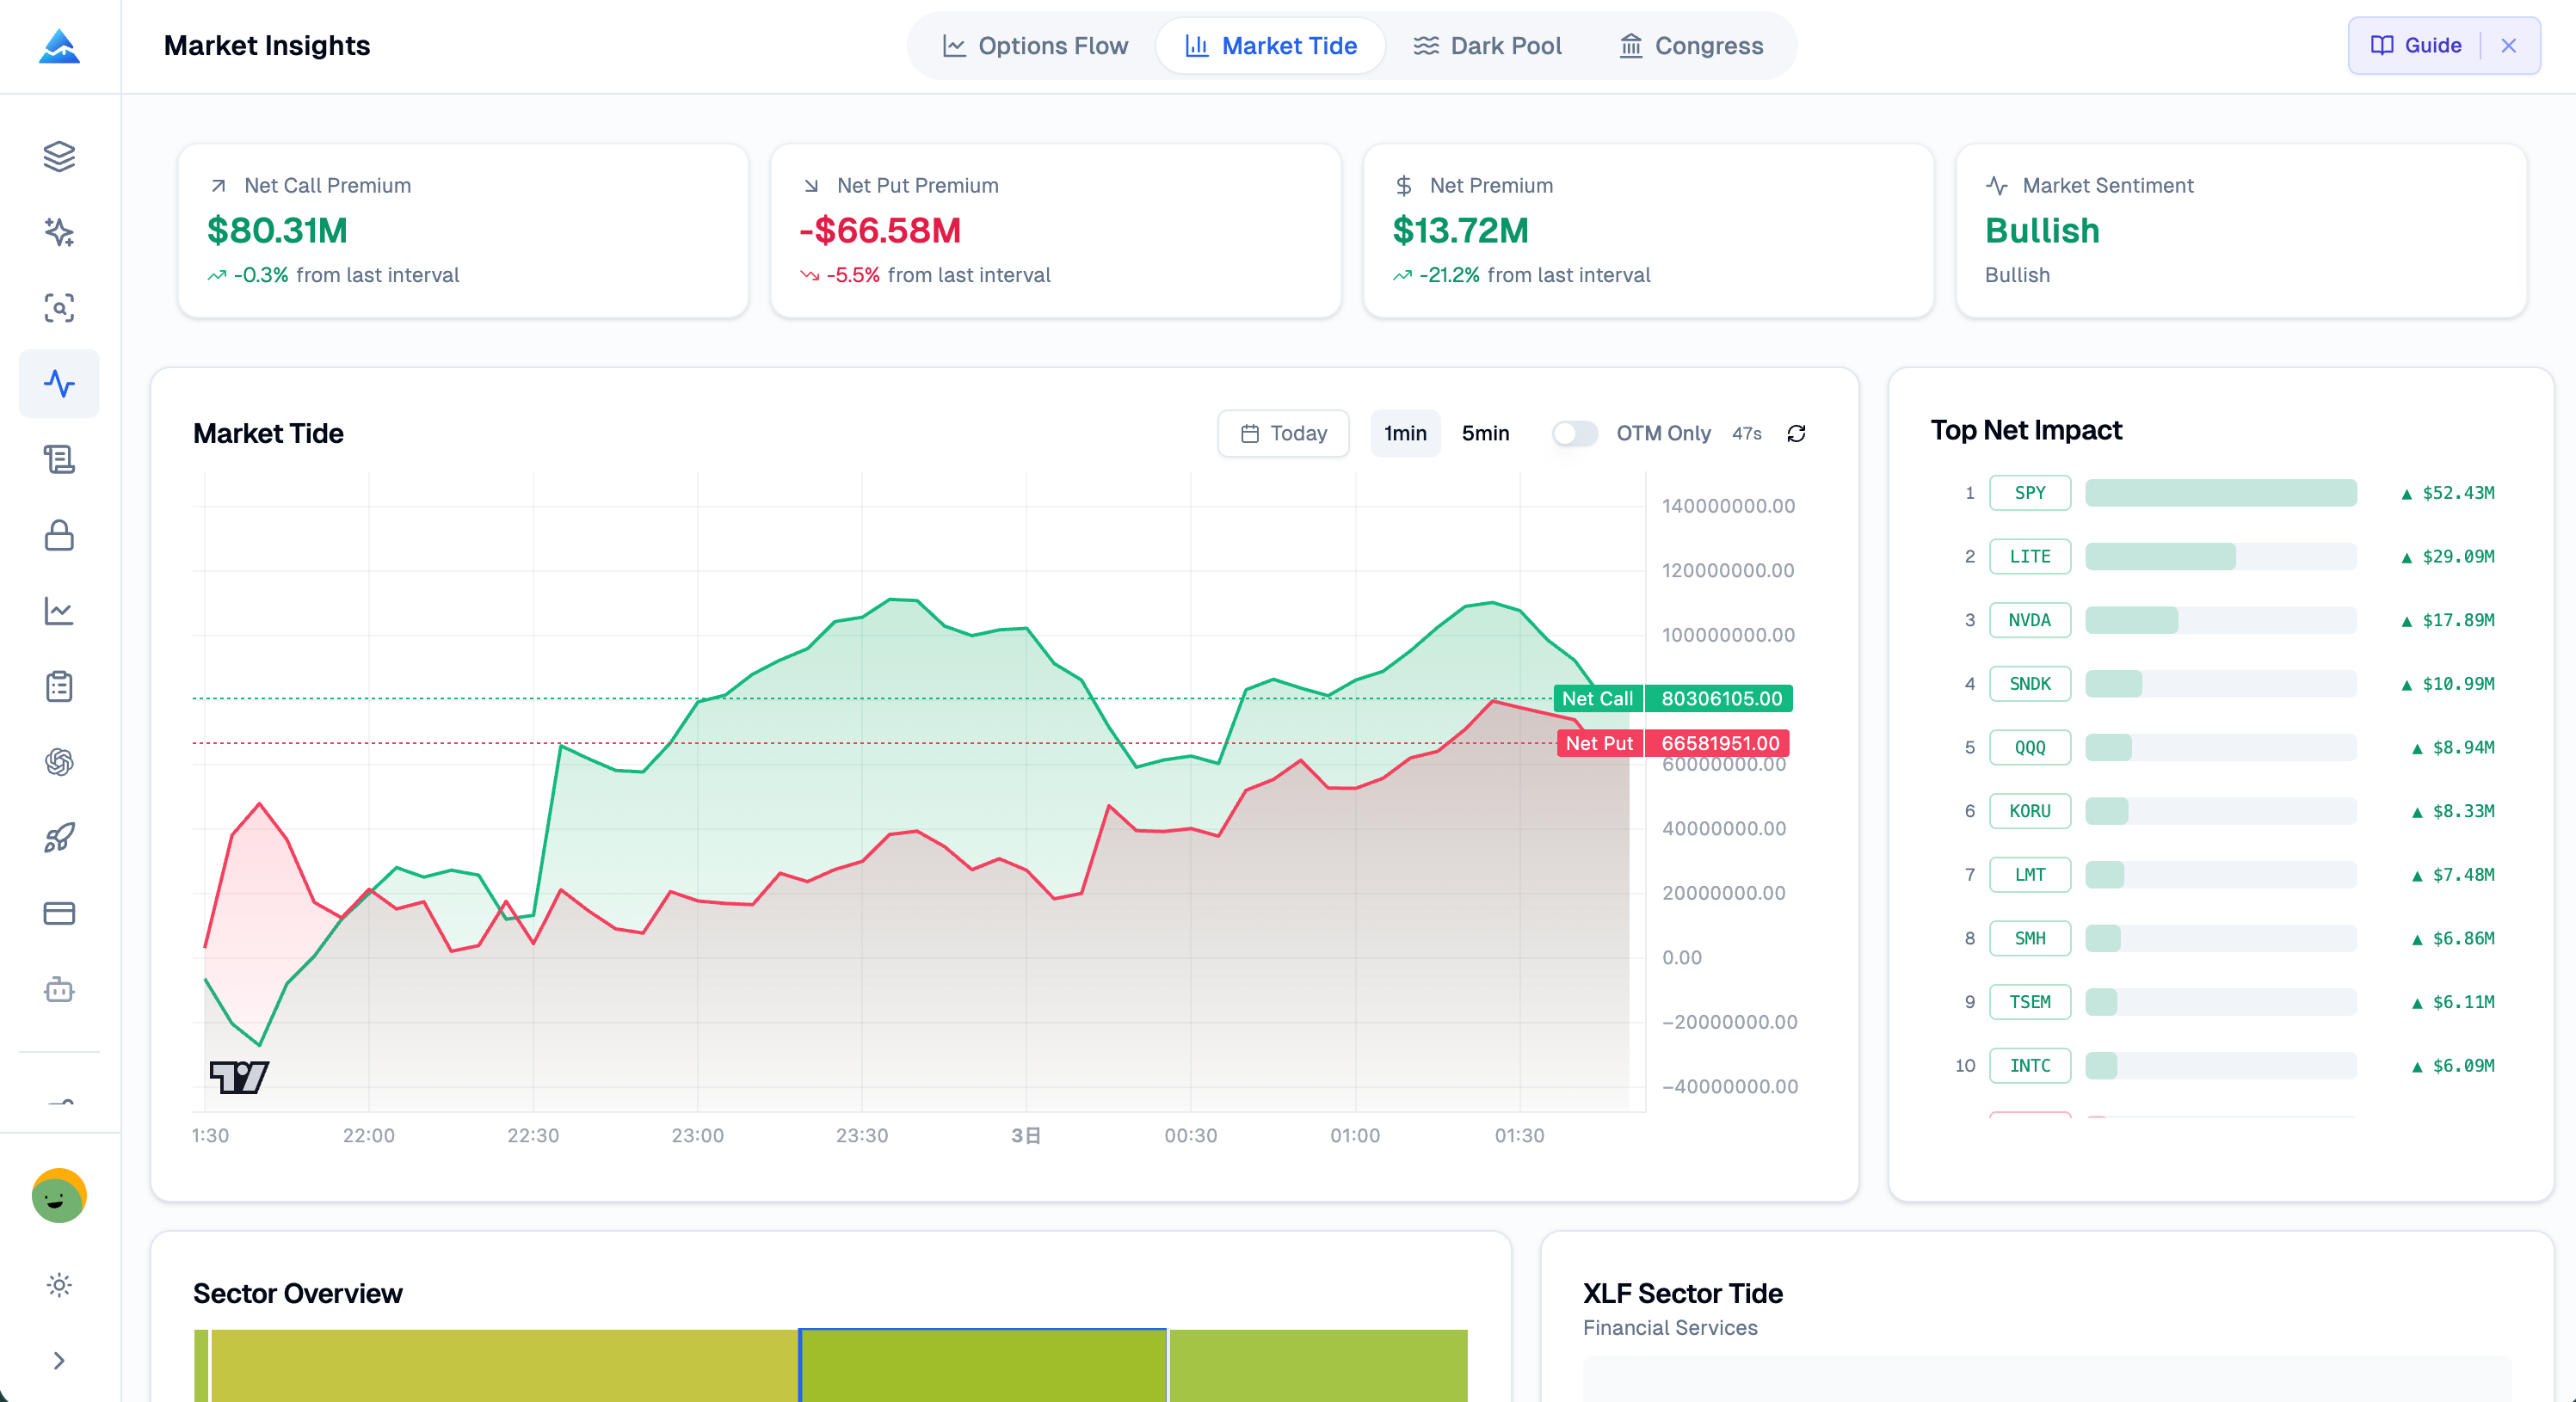
What Market Tide Shows You
Cumulative Net Premium Chart: A time-series view of net premium flow throughout the day. Rising line = bullish flow dominating. Falling line = bearish flow. Divergences between price and net premium often precede reversals.
Sector Heatmap: See which sectors attract bullish vs. bearish options flow. When tech gets hammered with puts while healthcare sees heavy call buying, you're watching sector rotation in real time.
Top Net Impact Rankings: Which stocks are driving the most net premium? If NVDA accounts for 30% of today's bullish premium, that's a concentrated institutional bet worth watching.
KPI Summary Cards: Instant readings on total call premium, total put premium, net premium, and the bullish/bearish ratio — all updated every 60 seconds.
I prefer Market Tide as my first check before any trade. If net premium is negative and I'm looking at a long position, I'll usually wait. It's saved me from entering against the flow more times than I can count.
How Traders Use Market Tide
Confirmation Signal: Before entering a long position, check Market Tide. If net premium is strongly bullish and rising, you have market-wide tailwinds. If it's negative and falling, you're swimming against the current.
Divergence Trading: When the S&P 500 makes new highs but net premium declines, institutions are hedging — a potential warning. When prices fall but net premium turns positive, smart money may be accumulating.
Sector Rotation Timing: The sector heatmap reveals where money flows before it shows up in price. A sudden shift from tech to energy in net premium can signal a rotation days before it appears on charts.
Dark Pool Intelligence: See What Institutions Are Hiding
Dark pools exist so institutions can trade massive blocks without moving the public market price. When a pension fund needs to sell 2 million shares of Apple, doing it on the NYSE would crash the price. Instead, they execute in a dark pool.
Why Dark Pool Data Matters
About 40% of U.S. equity volume now executes in dark pools. That means nearly half of all institutional activity is invisible on traditional exchanges. By monitoring dark pool prints, you can:
- Identify price levels where institutions accumulate or distribute
- Find hidden support and resistance that doesn't appear on standard volume profiles
- Detect large block trades that signal institutional conviction
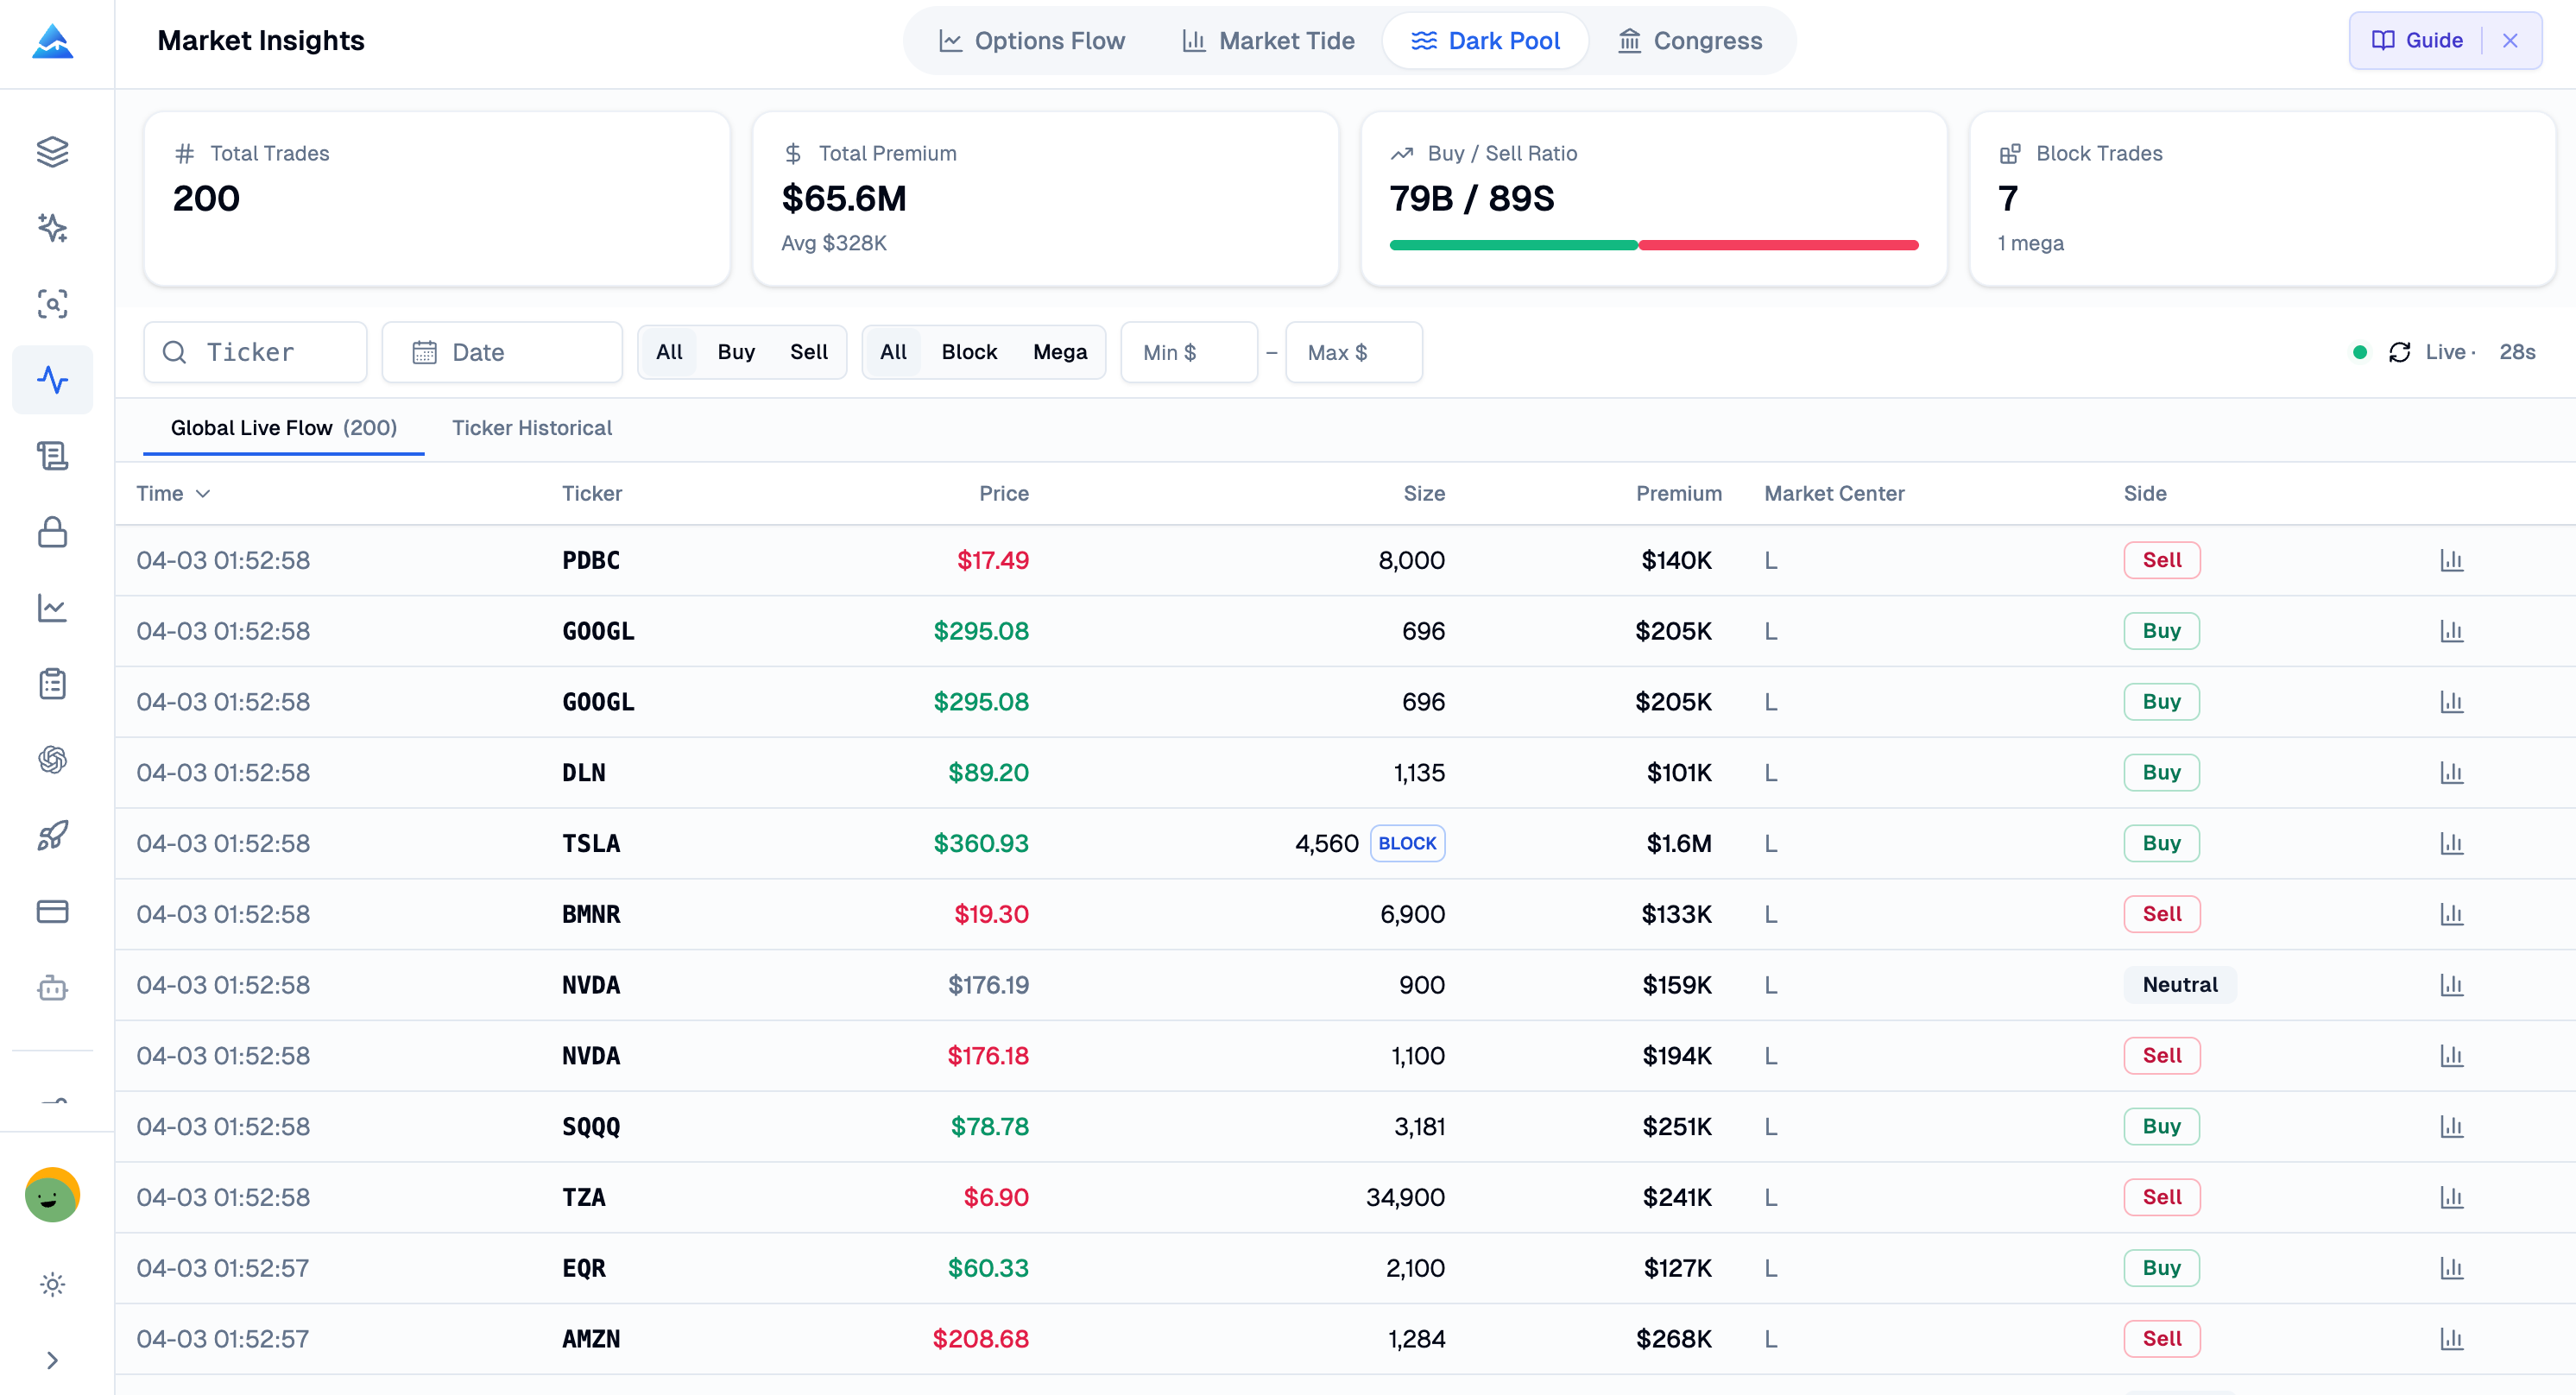
Pineify's Dark Pool Module Features
Real-Time Trade Feed: Every dark pool print is captured with timestamp, ticker, price, size, and estimated direction. Trades are categorized by size tier:
- Standard: Normal-sized trades
- Block: Large trades (typically 10,000+ shares)
- Mega Block: Massive institutional trades representing significant position changes
Direction Inference from NBBO: Since dark pool trades don't have a bid/ask, Pineify infers direction by comparing the execution price to the National Best Bid and Offer at the time. Trades at or above the midpoint are classified as buys; below as sells. I'll be upfront — it's not perfect. NBBO comparison gives you a statistical edge, not a guarantee. But in practice, I've found it reliable enough to build trades around.
Volume Profile Visualization: See where dark pool volume concentrates at each price level. Heavy volume at a specific price creates a "volume node" that often acts as support or resistance when price returns.
Point of Control and Value Area: The POC is the price level with the highest dark pool volume — where institutions traded the most. The Value Area covers 70% of total dark pool volume, defining the range where institutions see fair value.
Dark Pool Trading Strategies
Support/Resistance from Volume Nodes: When a stock pulls back to a level with heavy dark pool buying, that level often holds as support. Institutions don't like seeing their positions go underwater.
Mega Block Alerts: A single mega block trade can signal a major institutional decision. If a stock gets a $50M dark pool buy print, someone with deep pockets just made a big bet. These are rare and significant.
Accumulation Detection: When dark pool buy volume exceeds sell volume at a specific price range over multiple days, institutions are quietly accumulating. This pattern often precedes a breakout.
Congress Trading Tracker: Follow the Politicians
Under the STOCK Act of 2012, U.S. Congress members and their spouses must disclose stock trades within 45 days. Research shows congressional portfolios consistently outperform the market — which raises questions about whether lawmakers trade on non-public information from committee hearings and regulatory briefings.
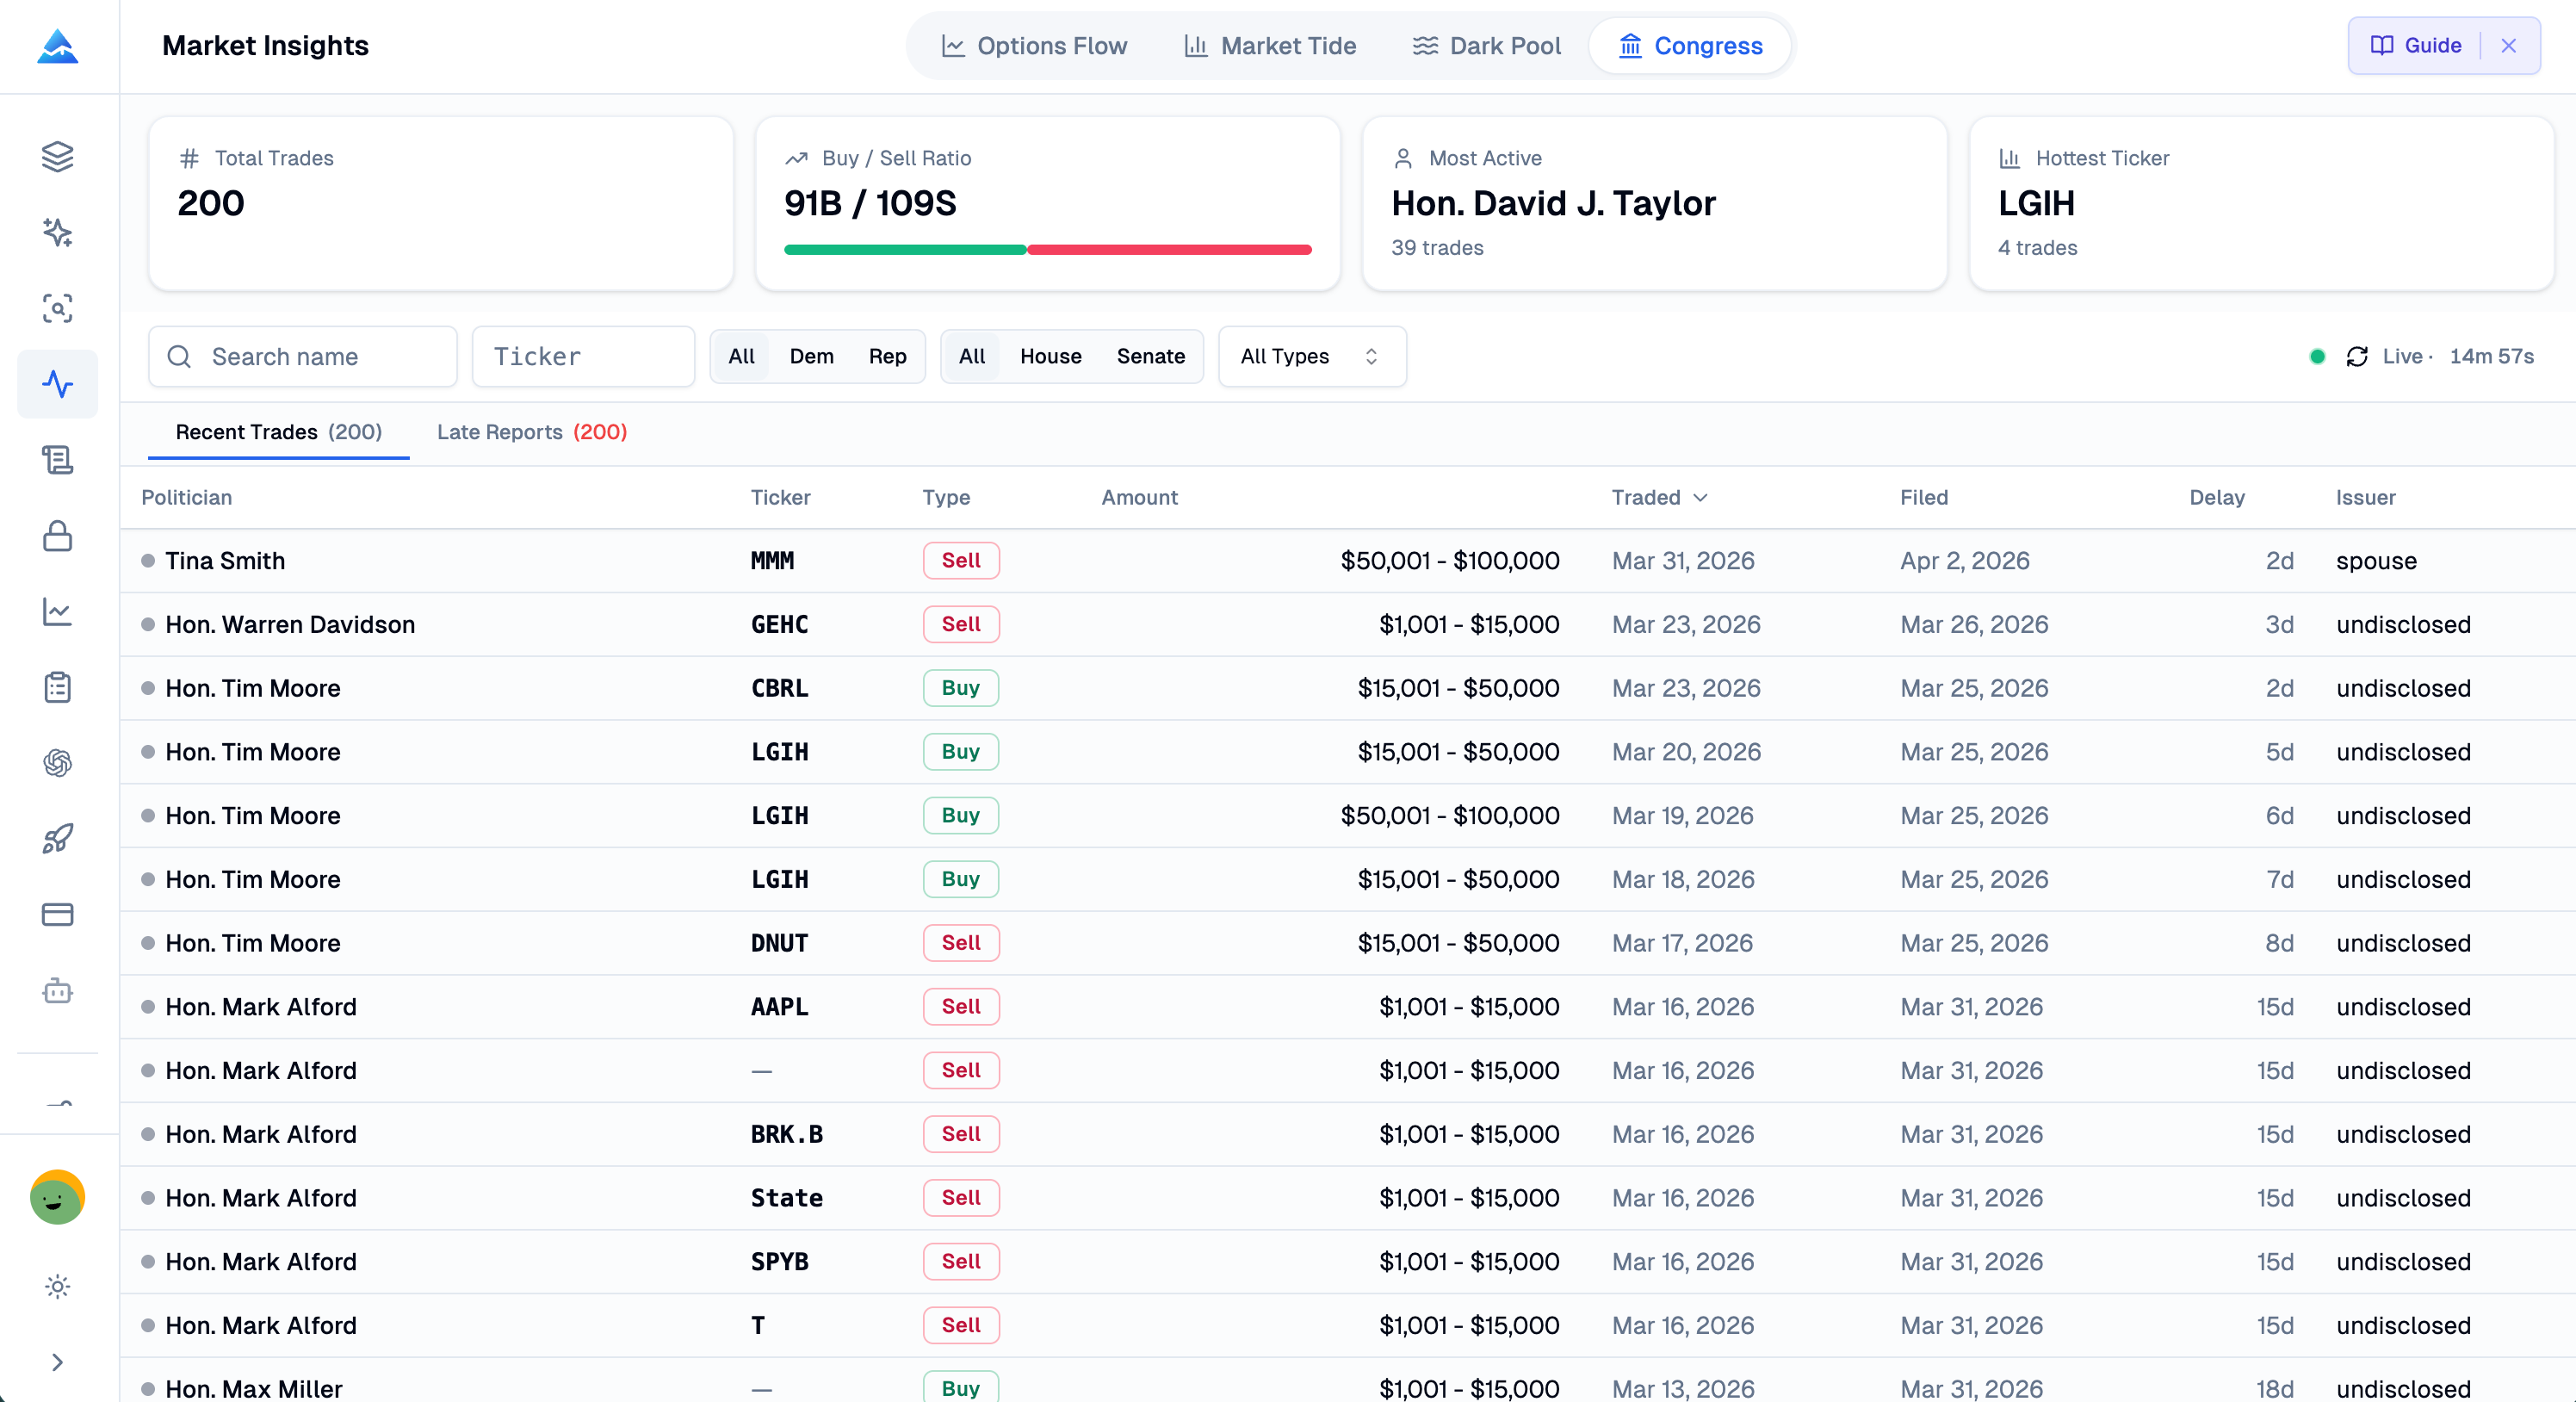
What the Congress Module Tracks�
Full Trade History: Every disclosed stock trade by each sitting member and their spouses. Filter by politician name, party, chamber, trade type, and date range.
Late Disclosure Alerts: The STOCK Act requires disclosure within 45 days, but many lawmakers file late. Pineify flags these — a late filing on a trade that happened right before a major regulatory announcement is worth investigating.
Politician Drill-Down: Click any lawmaker to see their complete trading history, most-traded tickers, buy/sell ratio, and average trade size. Some members trade dozens of times per quarter.
Hottest Tickers: Which stocks are Congress members buying most aggressively right now? This aggregated view reveals where political insiders are putting their money.
What to Watch For
Several academic studies found congressional portfolios outperform the S&P 500 by 5-10% annually. The debate continues on whether this comes from information access or luck, but the pattern is consistent enough that tracking these trades has become a legitimate signal.
I'll be honest though — the 45-day disclosure lag means you're looking at historical intent, not live positioning. That's a real limitation. You won't catch the day-of trade. What you can catch is the pattern: a senator who bought defense stocks before a military spending bill, or a House committee chair trading healthcare during regulatory negotiations.
Notable patterns:
- Pre-legislation trades: A lawmaker buying defense stocks weeks before a military spending bill
- Committee-aligned trades: Senate Banking Committee members trading financial stocks ahead of regulatory changes
- Bipartisan consensus: When both parties buy the same stock, the signal is stronger
How Market Insights Modules Work Together
The real power isn't any single module — it's the combination. Each data stream gives you a different angle on the same market. When multiple signals align, conviction increases dramatically.
Cross-Module Signal Confirmation
Scenario: You notice unusual call buying on XYZ in Options Flow. You open Dark Pool and see heavy block buying at the same price level. Market Tide shows the sector attracting positive net premium. And a senator just disclosed a large purchase of XYZ.
Four independent streams pointing the same direction. No single tool gives you that.
The Information Hierarchy
- Market Tide (macro): What's the overall sentiment?
- Options Flow (stock-level): Which stocks show unusual smart money activity?
- Dark Pool (institutional): Where are institutions building positions?
- Congress Trading (political): What do lawmakers with insider access think?
Start macro, narrow down, confirm.
Getting Started with Market Insights
Open Market Insights from your Pineify dashboard. You'll see four tabs — Options Flow, Market Tide, Dark Pool, and Congress Trading. Set your filters (minimum premium for options, trade size for dark pool, party or chamber for congress). Keep multiple modules open during the day. When one module flags something interesting, check the others for confirmation. The more that align, the stronger the signal.
Market Insights vs. Competing Platforms
| Feature | Pineify Market Insights | Unusual Whales | FlowAlgo | Quiver Quantitative |
|---|---|---|---|---|
| Options Flow | ✅ Real-time | ✅ Real-time | ✅ Real-time | ❌ |
| Dark Pool | ✅ Full analysis | ✅ Basic | ❌ | ❌ |
| Congress Trading | ✅ Full tracker | ✅ Basic | ❌ | ✅ Congress only |
| Market Tide / Net Premium | ✅ Sector-level | ❌ | ❌ | ❌ |
| Unified Dashboard | ✅ All-in-one | Partial | Single focus | Single focus |
| Additional Tools | AI Agent, Pine Script, Backtester | Limited | None | None |
| Pricing Model | Subscription (all tools included) | $55-75/mo | $75/mo | Free (limited) |
Most competitors offer one or two streams as separate products. Pineify combines all four in one dashboard, plus the full ecosystem — AI Finance Agent, Pine Script AI Coding Agent, Strategy Optimizer, and the Pine Script Backtester.
Who Should Use Market Insights?
Day Traders: Monitor options flow and dark pool prints in real time for intraday setups. Use Market Tide to confirm directional bias.
Swing Traders: Track sector rotation through Market Tide, spot accumulation in Dark Pool, and use Options Flow to time entries.
Options Traders: See which strikes and expirations others are committing premium to. Use that data for your own strategies.
Long-Term Investors: Follow congressional trading and dark pool accumulation to find stocks institutions are quietly building positions in.
Quant Traders: Build systematic strategies around options flow signals, dark pool volume profiles, and net premium divergences.
Pricing and Access
Market Insights is included in Pineify's premium subscription. One plan covers all four modules plus the full toolkit:
- ✅ All four Market Insights modules with real-time data
- ✅ AI Finance Agent for research and analysis
- ✅ Pine Script AI Coding Agent
- ✅ Visual Pine Script Editor
- ✅ Strategy Optimizer and Backtester
- ✅ Invite-Only Indicator access
- ✅ Trading Journal
- ✅ All future updates
Visit the pricing page for current plans.
Frequently Asked Questions
What is Pineify Market Insights?
It's a market intelligence suite that combines four tools in one dashboard: Options Flow for tracking unusual options activity, Market Tide for net premium sentiment, Dark Pool for institutional block trades, and Congress Trading for following congressional stock disclosures. You get all four modules in a single interface.
How does options flow tracking work?
The Options Flow module monitors every options trade in real time and classifies each trade by its execution price relative to the bid-ask spread. Trades at or above the ask are classified as bullish. Trades at or below the bid are bearish. You can filter by ticker, premium, sentiment, trade type, and expiration.
What is dark pool data and why should I care?
Dark pools are private exchanges where institutions trade large blocks without moving public market prices. About 40% of U.S. equity volume flows through them. Monitoring dark pool prints helps you spot where institutions are building or exiting positions and find support and resistance levels normal charts don't show.
How accurate is the congress trading data?
It comes directly from official STOCK Act disclosures filed with the U.S. House and Senate. Pineify aggregates these filings and flags late disclosures. The accuracy matches the filings themselves. Just remember the data has a 45-day lag — you're tracking historical intent, not live moves.
Is the data real-time?
Options Flow and Dark Pool update in real time during market hours with smart polling. Market Tide refreshes every 60 seconds. Congress Trading updates as new disclosures are filed. Smart polling pauses when you navigate away and resumes when you come back.
How is Market Insights different from Unusual Whales or FlowAlgo?
Those platforms offer one or two data streams as separate products. Pineify Market Insights combines all four — Options Flow, Market Tide, Dark Pool, and Congress Trading — in a single dashboard. And it's part of a broader platform with AI research agents, Pine Script tools, and strategy optimization.
Can I use Market Insights with other Pineify tools?
Yes. It's designed to work alongside the full Pineify ecosystem. Research stocks with the AI Finance Agent, spot opportunities with Market Insights, build indicators with the Pine Script AI Coding Agent, and backtest with the Strategy Optimizer — all from one platform.
Ready to see what Wall Street sees? Try Pineify Market Insights and get real-time options flow, dark pool intelligence, congressional trading data, and market tide analysis in one dashboard.