Pineify Visual Editor Builds Pine Script Without Writing Code
I killed three hours last month debugging a Pine Script strategy because I missed a single closing parenthesis. A visual Pine Script editor is a structured builder that turns block-based logic into standard Pine Script (v5/v6) for TradingView. Instead of memorizing ta.* function names and wrestling with delimiter matching, you compose indicators, strategies, and screeners by connecting blocks. The platform generates clean code you paste straight into the chart.
Pineify's Visual Editor is the workflow I wish I had on day one. You stay focused on market structure, not syntax. I've used it to build a real AAPL volatility scanner, and it cut my iteration time in half compared to writing Pine Script by hand. Here's how the three builders differ and how I use them end to end.
Visual Indicator Builder
The indicator path is where most people start. I started there too. The Visual Indicator Builder exposes more than 235 built-in indicators plus candlestick pattern blocks you can chain before the editor emits Pine Script.
Why 235 matters: when you're comparing RSI, ADX, and ATR on the same SPY daily chart, you don't want to hunt through separate reference docs. I routinely stack two or three ideas — a trend filter, a momentum trigger, and a volatility gate — and let the builder keep the wiring consistent. I've also tested candlestick pattern recognition on a QQQ scanner I built last month: patterns become first-class inputs instead of hand-written pattern scanners that are easy to get subtly wrong.
I still verify plots and inputs on my charts. But I've noticed that I spend far less time chasing "undeclared identifier" errors because the editor handles the boilerplate and the repetitive ta.* calls. That's been the biggest time saver in my workflow since April.
- Choose from 235+ built-in indicators and related building blocks.
- Add candlestick pattern recognition without writing custom pattern logic by hand.
- Combine multiple indicators into one cohesive script with consistent inputs.
- Auto-generate Pine Script aimed at compiling cleanly on TradingView.
Visual Strategy Builder
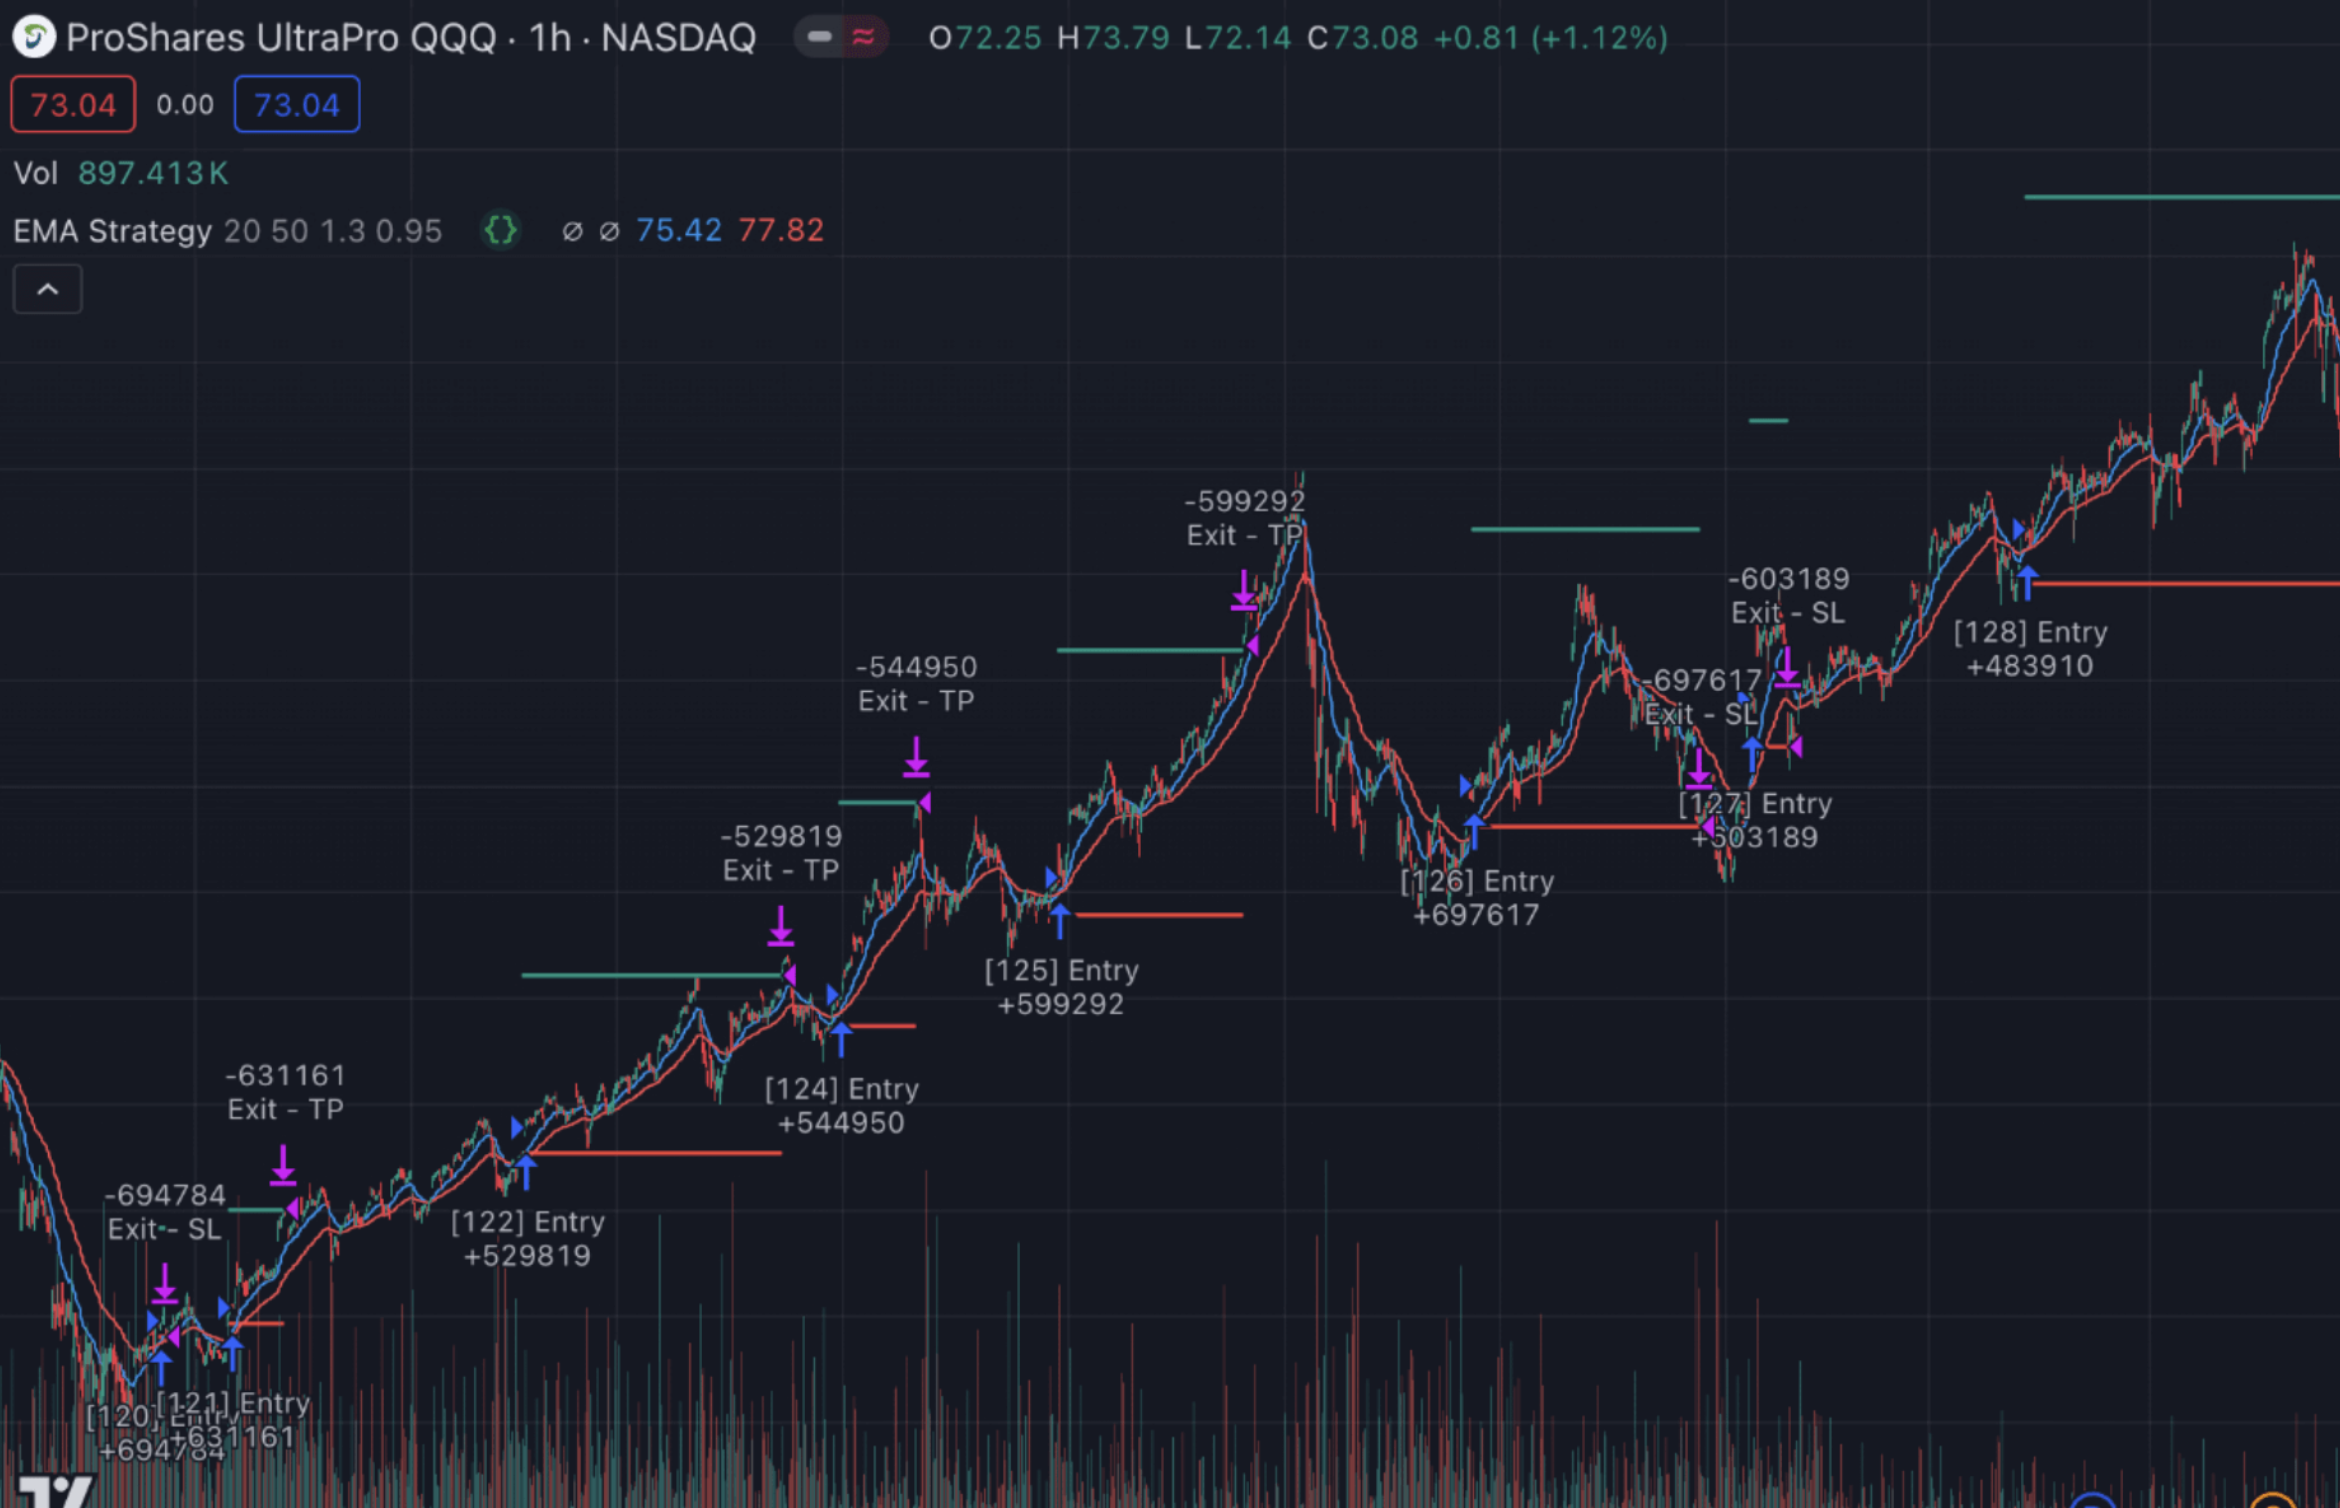
Strategies are where small mistakes cost real money. A strategy is not only an entry signal; it's also how you size risk, where you admit the trade is wrong, and how you take profit. The Visual Strategy Builder maps those concepts to visual entry and exit rules, which I find easier to reason about than scrolling through hundreds of lines I did not write.
Stop loss and take profit management sit next to each other in the builder, which mirrors how I think about trade management. Risk settings become explicit instead of buried three functions deep. When I want a quick sanity check, I define the idea visually, generate code, and backtest instantly on TradingView so the chart tells me whether the logic matches my intent.
Multi-timeframe thinking shows up in my process too. I prefer anchoring a higher-timeframe bias on the weekly SPY chart while executing triggers on the 15-minute. The builder keeps that structure legible so I don't accidentally mix timeframes in a way that repaints or contradicts itself. I've found this especially useful for swing trades on TSLA where the daily and 1-hour often tell different stories.
I haven't tested every edge case in the strategy builder — for instance, complex pyramiding logic still needs manual Pine Script tweaks in my experience. Check the backtesting guide if you want to validate your strategies with detailed metrics.

Screener Generator
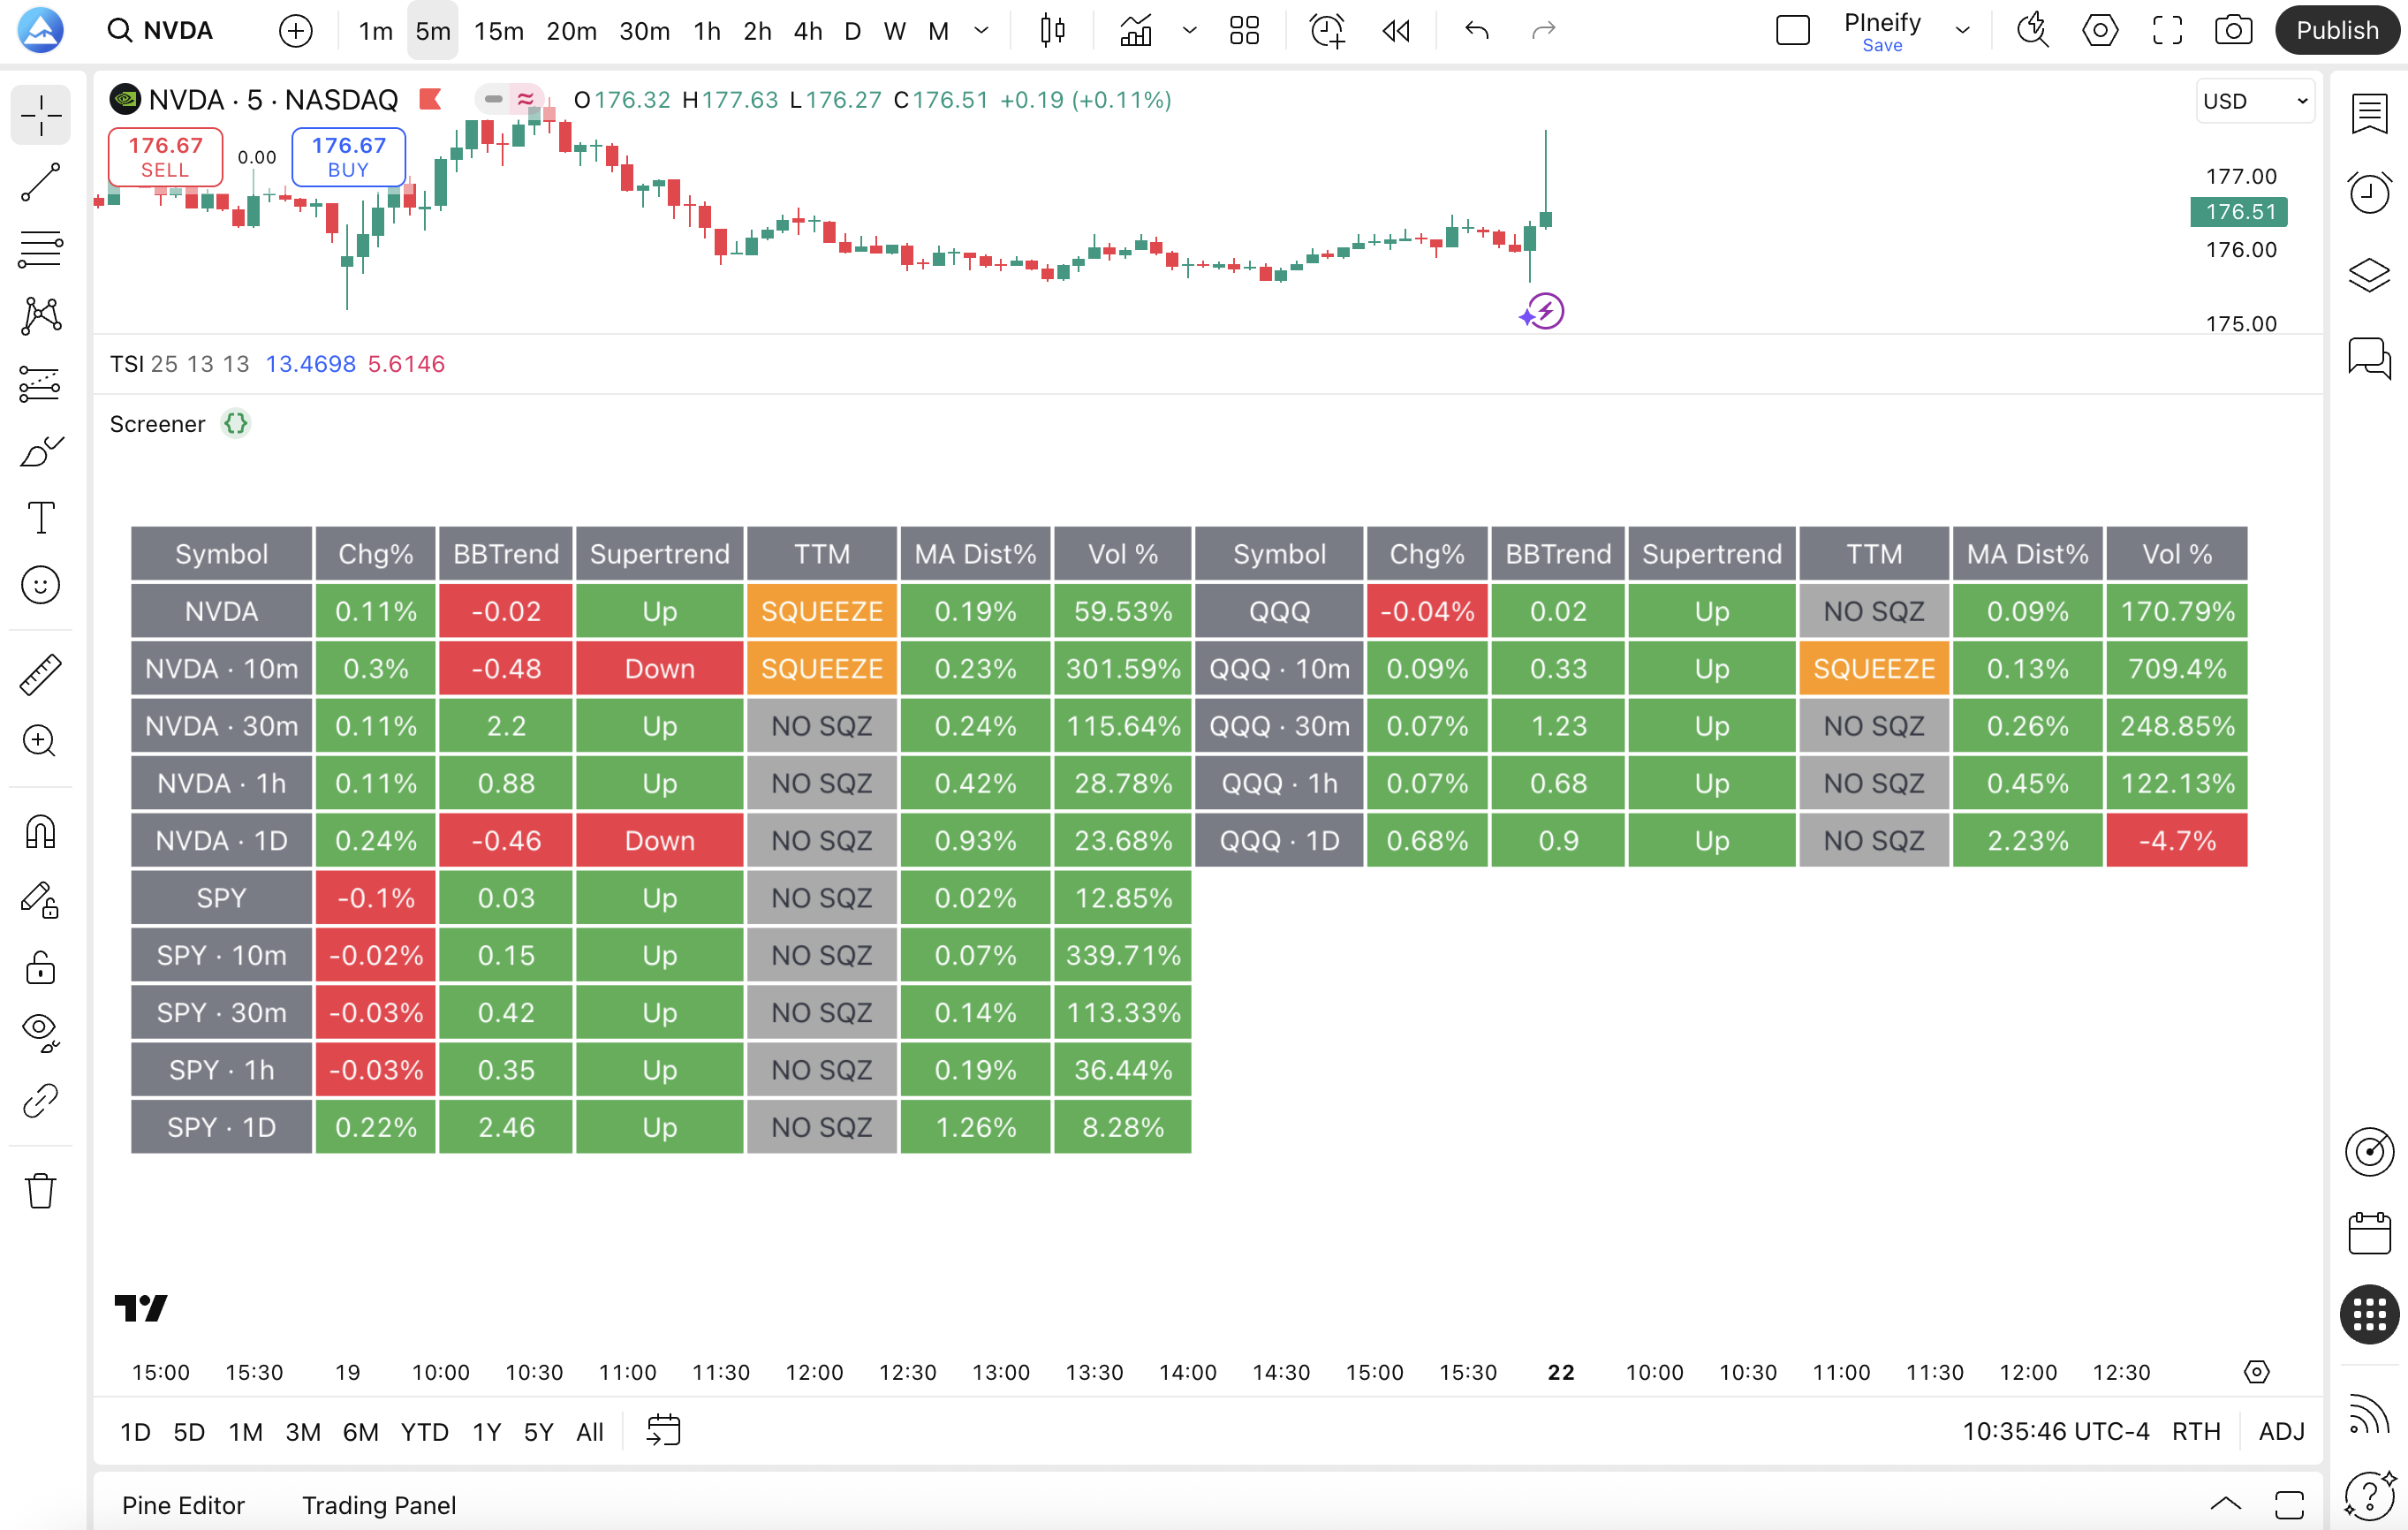
Screeners are underrated until you need them. The moment you want the same condition evaluated across a watchlist, a manual chart flip stops scaling. The Screener Generator is built for that workload: scan multiple symbols and timeframes, express filtering conditions in the same visual style as indicators and strategies, and move the result toward TradingView without rebuilding everything from scratch.
In my own scans, custom filtering conditions are the difference between noise and a shortlist I can actually trade. I've set up a daily screener for SPY sector ETFs that flags RSI divergences across eight tickers in one pass. Real-time alerts are the second half of the value: I want the platform to notify me when the screener's logic fires, not when I remember to refresh a list. One-click export to TradingView is the bridge — I treat it as the handoff point where the structured generation meets TradingView's native screener environment.
- Scan multiple symbols and timeframes from one structured definition.
- Build custom filtering conditions visually instead of guessing screener syntax.
- Attach real-time alert thinking at the design stage, not as an afterthought.
- Export toward TradingView with minimal friction when you're ready to go live.
Additional Capabilities
Three adjacent capabilities round out the editor for how I actually trade.
Import Custom Code is the bridge back to text. When I already have a snippet that does something specific, I can bring it in and let the editor parse signals and variables so they become usable inside the visual model. That saves me from rewriting working ideas just to fit a new UI. This is also how you'd integrate output from the AI Pine Script generator — generate the logic there, import it here, and wire it into a visual strategy.
Real-Time Alerts matter because trading is time-sensitive. I set up complex alert conditions visually because branching logic is easier to audit when it's graph-like. When a strategy triggers, I want the notification story to match the chart story. The strategy automation guide covers how to take this further with fully automated execution.
AI Assistance is the accelerator for the parts I don't want to do manually. The Coding Agent can modify code, explain logic, or help tune parameters when I'm stuck. I still verify everything on the chart, but the loop is shorter than bouncing between search results and half-compatible examples.
One limitation I'll call out: the editor is not great for highly bespoke statistical models. If you need to code a custom Monte Carlo simulation from scratch, you're better off writing it manually or importing it through the Custom Code feature.
How to Use the Visual Editor
Here is the workflow I use when I want a clean handoff and fewer surprises. It works across all three artifact types.
- Pick the artifact type first — indicator, strategy, or screener — so the builder exposes the right constraints from the start.
- Add the core market read (trend, momentum, volatility, patterns) using the built-in library, including candlestick pattern recognition when it's part of the thesis.
- Layer risk and execution for strategies (entries, exits, stop loss, take profit) or filters and universes for screeners (symbols, timeframes, conditions).
- Generate Pine Script and paste it into TradingView, then confirm plots, tables, and strategy reports match what you intended.
- Iterate visually when the chart disagrees with you — change blocks, regenerate, and re-run backtests or scans instead of editing blind.
That sequence keeps multi-timeframe intent explicit: decide where the bias lives, where the trigger lives, and whether the screener or strategy should enforce alignment.
Frequently Asked Questions
▶What is Pineify Visual Editor?
It's a no-code workspace that turns block-based logic into standard Pine Script for TradingView. You pick from three artifact types — indicators, strategies, and screeners — connect blocks visually, and the platform generates clean, compilable Pine Script (v5/v6) ready to paste into TradingView.
▶How do I use the Visual Indicator Builder?
Open the indicator builder from the editor. Pick from 235+ built-in indicators and candlestick pattern blocks, then arrange them in whatever order makes sense for your thesis. You can combine multiple indicators into one script with consistent inputs. Hit generate, paste the output into TradingView, and verify your plots and inputs on the chart.
▶How does Pineify Visual Editor differ from writing Pine Script manually?
Manual Pine Script means remembering syntax, function names, and TradingView runtime rules. The Visual Editor replaces all that with visual blocks. It eliminates common compile errors — undeclared identifiers, mismatched delimiters, that kind of thing — while generating structured Pine Script that compiles cleanly on TradingView.
▶Can I use the Visual Editor for multi-timeframe strategies?
Yes. The Visual Strategy Builder supports multi-timeframe setups: anchor a higher-timeframe bias while executing triggers on the chart you're actually trading. The builder keeps the timeframe structure legible and prevents accidental mixing that could cause repainting or contradictions.
▶What are the limitations of the no-code visual editor?
The Visual Editor handles most indicator, strategy, and screener use cases well. But if you need extremely complex custom logic — say, a unique position-sizing model or a statistical arbitrage formula — you may still need manual Pine Script adjustments. The Import Custom Code feature bridges this gap by letting you bring existing snippets into the visual workflow. Always verify generated code on TradingView before using it in live trading.