Pineify Screener: A TradingView-Powered Technical Market Scanner

Markets rarely present opportunities one chart at a time. A breakout may be forming in one stock, momentum may be accelerating in another, and unusual volume may be appearing in a crypto pair while you are still switching tabs.
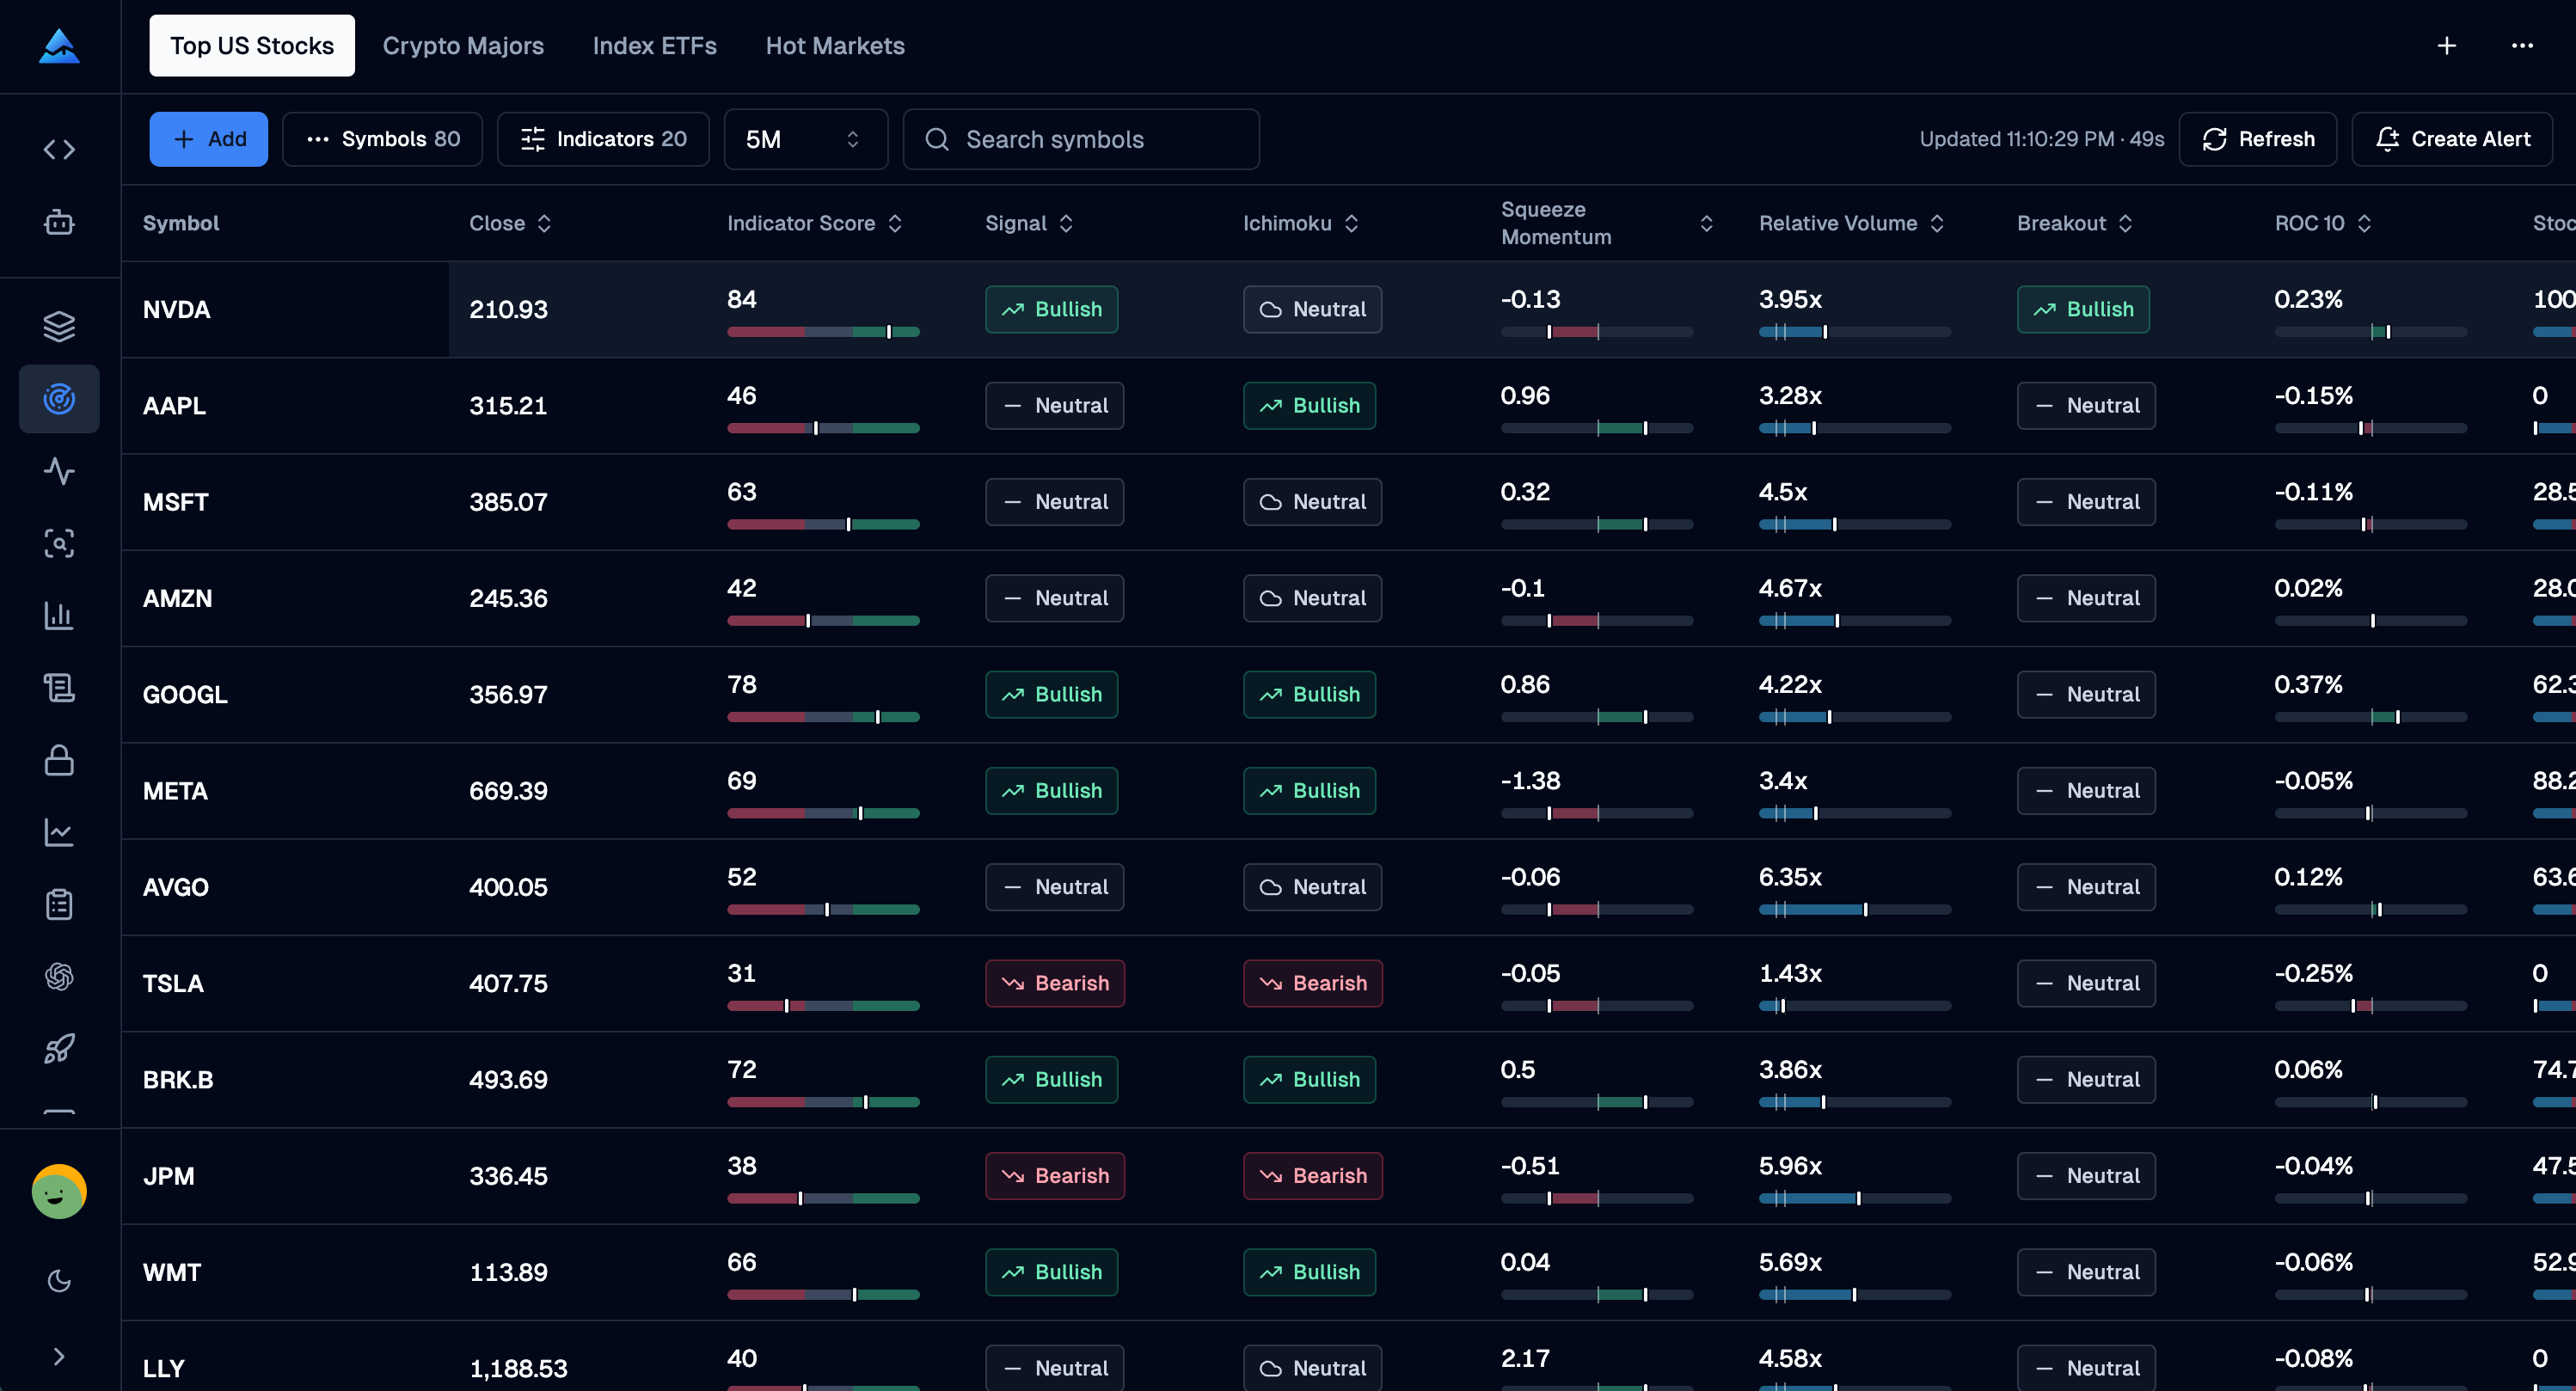
Pineify Screener organizes supported technical snapshots in collections. It brings TradingView-powered technical data for stocks, crypto, ETFs, and other supported markets into a fast, visual table where you can compare signals, organize watchlists, and identify the instruments that deserve your attention.
The Screener library now includes 300 technical fields across seven categories. Instead of opening dozens of charts to answer basic questions, you can compare price action, trend, momentum, volatility, volume, performance, and composite signals side by side, then narrow a large market universe to the charts worth investigating.
Key Takeaways
- Scan multiple markets from a single technical-analysis workspace.
- Start immediately with editable collections for leading US stocks, major crypto assets, hot markets, and index ETFs.
- Choose from 300 technical fields. Display up to 20 columns across as many as 100 symbols in one collection.
- Use visual meters, signal badges, relative bars, and directional states alongside the reported values.
- Choose one timeframe for an entire collection or assign different timeframes to individual symbols.
- Keep the workspace current with automatic refreshes and on-demand updates.
- Click a symbol to move from screening into a detailed stock view without losing your screening context.
What Is Pineify Screener?
Pineify Screener is a customizable technical market scanner built around indicator snapshots reported from TradingView. It organizes the latest supported market data into collections, then presents each symbol as a row and each selected indicator as a column.
This structure supports comparison when the symbols, timeframes, and units are compatible. You can look for questions such as:
- Which symbols have the strongest composite indicator scores?
- Where are price and the major EMAs aligned bullishly?
- Which assets are breaking out of their recent range?
- Where is relative volume unusually high compared with normal activity?
- Which symbols show bullish Supertrend, MACD, or momentum conditions?
- Which instruments are overbought, oversold, or still neutral?
Pineify does not force every trader into the same preset scan. You decide which symbols matter, which timeframe fits the trade, and which indicators should define your view of the market.
Stop Searching Chart by Chart
A traditional chart workflow is excellent for deep analysis but inefficient for discovery. If you track 50 symbols and inspect only three timeframes per symbol, that can mean 150 chart states before you have even started comparing candidates.
Pineify Screener reverses the workflow:
- Scan the market in one table.
- Compare the technical states that matter to your strategy.
- Sort or search to isolate the strongest candidates.
- Open the symbol detail view for deeper research.
- Return to the collection with your screening context intact.
The screener acts as a decision filter. It helps you spend less time navigating and more time examining the opportunities that already meet your attention criteria.
Four Ready-to-Use Market Collections
Opening a new screener should not begin with an empty screen. Pineify provides four market collections so you can start scanning immediately:
| Collection | What It Helps You Monitor |
|---|---|
| Top US Stocks | Leading US companies across technology, finance, healthcare, consumer, industrial, and other major sectors |
| Crypto Majors | Widely followed crypto pairs, from Bitcoin and Ethereum to large-cap and actively traded altcoins |
| Hot Markets | A broad set of actively monitored instruments with current screener data |
| Index ETFs | Major index, sector, factor, bond, commodity, international, and thematic ETFs |
These are starting points, not locked templates. Rename them, reorder them, change their symbols, adjust their indicators, or create entirely new collections around your own workflow.
You might build separate collections for:
- AI and semiconductor leaders
- High-momentum crypto pairs
- Sector rotation ETFs
- Earnings watchlists
- Long-term portfolio holdings
- Breakout candidates
- Intraday trading setups
Each user can maintain up to 15 collections, with as many as 100 symbols in each collection.
Build a Screener Around Your Trading Style
Add Multiple Symbols at Once
Building a watchlist symbol by symbol is slow. Pineify supports batch selection, allowing you to search the supported universe and add multiple instruments in one action.
Search focuses on the ticker name, so finding assets remains direct even when the underlying market data comes from different TradingView exchanges or feeds. The available universe is tied to symbols with supported screener coverage, helping keep the workspace focused on instruments that can return useful data.
Reorder and Remove Symbols in One Place
The Manage Symbols workspace gives you control over the default row order. Drag symbols into the sequence that matches your process, remove names that are no longer relevant, and save the collection as a single organized update.
This is useful when your preferred order carries meaning: portfolio weight, conviction, sector grouping, trade priority, or a morning review sequence.
Organize Collections Your Way
Collections can also be reordered through a dedicated management view. Put the lists you use every day first and keep secondary research groups within reach. Your active collection is remembered, so returning to the Screener takes you back to the market view you were using.

Compare the Indicators That Matter
Every trading method emphasizes different evidence. A trend follower may care about SMA and EMA alignment, Hull MA, Supertrend, Parabolic SAR, Aroon, or Ichimoku. A momentum trader may focus on RSI, MACD, Stochastic, CCI, Williams %R, TSI, PPO, or Coppock Curve. A volume-focused trader can compare Relative Volume, MFI, OBV, Chaikin Money Flow, and Chaikin Oscillator.
Pineify currently provides 300 technical fields across seven practical groups. Each collection can display up to 20 of them at once:
| Category | Example Indicators |
|---|---|
| Price Action | Open, high, low, close, range position, breakout state |
| Trend | SMA and EMA 20/50/200, Hull MA, VWMA, Supertrend, Parabolic SAR, Aroon, Alligator, ADX, DMI, VWAP position, Ichimoku |
| Momentum | RSI, MACD, Stochastic, Stoch RSI, CCI, Williams %R, Awesome Oscillator, Ultimate Oscillator, Elder Ray, TSI, PPO, Coppock Curve, WaveTrend |
| Volatility | ATR percentage, Bollinger position, Bollinger width, squeeze state |
| Volume | Relative Volume, volume state, MFI, OBV state, Chaikin Money Flow, Chaikin Oscillator |
| Performance | 1-, 5-, 10-, 20-, 60-, 120-, and 252-bar returns |
| Composite | Trend score, momentum score, final indicator score, and overall signal |
Use search to find an indicator by name, key, description, or category. Sticky category headers keep the current group visible while you browse the full library. Selected indicators appear in the order you choose, so you can drag them into the exact column sequence that matches how you read a setup and save that layout to the collection.
Technical Data You Can Read at a Glance
Pineify combines reported values with visual scales and labels. Inspect the metric definition as well as its color.
Bullish, Bearish, and Neutral Signal States
Directional indicators use semantic labels and icons instead of exposing internal codes. Bullish, bearish, neutral, above, below, cross-up, cross-down, squeeze, overbought, and oversold states are visually distinct while still retaining readable text.
That makes it easier to scan a row and recognize alignment. When trend, momentum, and the composite signal point in the same direction, the setup stands out naturally.
Fixed Technical Zones
Indicators with established domains use stable visual scales. RSI, Stoch RSI, Stochastic, MFI, and Ultimate Oscillator show their position across technical zones. CCI, Williams %R, TSI, and Chaikin Money Flow use their own meaningful ranges, while ADX communicates weak and strong trend regions. Composite scores show bearish, neutral, and bullish ranges on a consistent 0-to-100 meter.
Paired and Zero-Line Comparisons
Aroon Up and Down or Stochastic %K and %D can share a track with distinct marker shapes, making their relationship visible without relying on color alone. Zero-line indicators such as Awesome Oscillator, Elder Ray, PPO, Coppock Curve, and Chaikin Oscillator keep positive and negative direction easy to recognize while preserving the reported value.
Relative Strength Within the Current Collection
Some values are more useful in comparison than in isolation. Pineify scales Relative Volume, ATR percentage, Bollinger Band width, Rate of Change, PPO, and Coppock Curve against the current collection where a shared scale supports meaningful comparison.
If one symbol has 5.5x relative volume and another has 8x, their bars no longer look equally full simply because both exceeded a fixed threshold. The strongest value in the collection defines the visual range, while meaningful reference levels such as 1x and 1.5x volume remain visible.
These bars compare the selected metric within the collection. A larger ATR or band width means greater volatility magnitude, not a stronger bullish signal. Changing collection membership can change the scale.
Helpful Context on Hover
Indicator headers and cells provide concise explanations and scale context. You can understand what the metric represents without leaving the table or memorizing every technical field.
One Timeframe or a Custom Timeframe per Symbol
Not every watchlist should work the same way. Pineify supports two collection modes.
Same Timeframe for Every Symbol
Use a single timeframe when you want an apples-to-apples market comparison. Switch the collection between:
1M, 5M, 15M, 30M, 1H, 2H, 4H, and 1D.
This mode is ideal for scanning one trading horizon, such as daily swing setups or 15-minute intraday momentum.
Custom Timeframe per Symbol
Use individual timeframes when the collection represents a workflow rather than a uniform market scan. A long-term holding might use the daily view, while an active trade uses 15 minutes and a crypto position uses one hour.
When adding symbols in this mode, choose one timeframe and add multiple symbols to it in the same action. You can also include the same market symbol at another timeframe when you want to monitor distinct setups.
Search, Sort, and Focus
Large collections remain manageable through fast local search and indicator sorting.
- Search by ticker name to isolate a symbol instantly.
- Sort supported indicator columns to bring the strongest or weakest values to the top.
- Clear the temporary sort to return to your saved symbol order.
- Switch collections without rebuilding the layout.
The Symbol column remains a stable identity anchor rather than another arbitrary sorting control. This keeps the interaction focused on ranking the technical evidence that changes.
Fresh Data Without Constant Manual Work
Pineify Screener requests a refresh of the active collection every 60 seconds while the page is visible. A countdown shows when the next update is due, and a manual Refresh action is available when you want to check immediately.
Updates are designed to preserve context. Existing rows remain visible while a new timeframe or snapshot is loading, with a clear refresh overlay instead of replacing the workspace with an empty state. When the underlying data has not changed, Pineify keeps the current snapshot rather than rebuilding the table unnecessarily.
The data is based on the values reported by Pineify's TradingView Alert pipeline. Pineify displays those reported OHLC and indicator values as received; it does not silently recalculate signals in the app using a different formula.
Check freshness and comparability
A successful refresh can return an unchanged snapshot. The page's Updated time describes retrieval, not necessarily a new bar or a fresh underlying alert. Check the available bar and received timestamps, missing fields, and error state before treating a row as current.
A 20-bar return on a one-minute row and a 20-bar return on a daily row cover different periods. Volume fields also depend on the feed; tick volume and exchange volume are not interchangeable. The 300 fields include values, states, and scores, not 300 independent forecasts. A composite score is not a probability of profit.
Move from Screening to Deeper Analysis
A screener should narrow the field, not become a dead end. Click a symbol row to open Pineify's detail view and continue researching the instrument. This creates a natural progression from broad comparison to focused analysis without forcing you to reconstruct what caught your attention.
The result is a practical workflow:
Scan → compare → prioritize → inspect → decide.
Who Is Pineify Screener For?
Active Traders
Monitor short-term momentum, breakouts, volume expansion, and trend changes across a focused list without cycling through chart tabs.
Swing Traders
Compare daily or multi-hour trend alignment, composite scores, RSI conditions, and volatility across a candidate watchlist.
Crypto Traders
Keep major and emerging pairs in one collection, then use relative volume and momentum states to identify where activity is concentrating.
ETF and Macro Traders
Track index, sector, international, bond, commodity, and thematic ETFs to see rotation and directional changes across markets.
Long-Term Investors
Use technical conditions as a timing and risk-awareness layer around a portfolio or research list, while opening symbol details when a name requires closer review.
How to Start Using Pineify Screener
- Sign in to Pineify.
- Open Screener from the main navigation.
- Start with Top US Stocks, Crypto Majors, Hot Markets, or Index ETFs.
- Choose a timeframe that matches your trading horizon.
- Open Indicators and arrange the technical columns you rely on.
- Add or remove symbols to turn the collection into your own watchlist.
- Sort a signal or metric column to surface candidates for deeper analysis.
- Click a symbol to continue into its detailed view.
Accounts below the required plan can preview the default workspace. Symbol identities and non-null price fields are masked, and management controls require access. The current full-access threshold is Expert or higher; check the account entitlement before relying on a feature.
The current Create Alert control shows a Coming Soon notice. It does not create an alert, and the notice does not establish a release date.
What Pineify Screener Is Not
Pineify Screener is built for current technical comparison and opportunity discovery. The first version is not a historical backtester, a custom formula engine, or a trade execution terminal. It does not replace due diligence or guarantee that a bullish technical signal will produce a profitable trade.
Its purpose is narrower and more useful: organize a large amount of technical market information into a workspace that helps you decide where to look next.
Frequently Asked Questions
What is Pineify Screener?
Pineify Screener is a customizable technical market scanner that displays TradingView-powered indicator snapshots for supported stocks, crypto assets, ETFs, and other instruments in a visual comparison table.
How many symbols can I add to a Pineify Screener collection?
Each collection can contain up to 100 symbols. You can batch-select multiple symbols when adding them and organize their saved order through the Manage Symbols view.
How many technical fields can I display?
Pineify currently offers 300 technical fields across price action, trend, momentum, volatility, volume, performance, and composite signals. You can select and arrange up to 20 columns per collection.
Which timeframes does Pineify Screener support?
Pineify Screener supports 1-minute, 5-minute, 15-minute, 30-minute, 1-hour, 2-hour, 4-hour, and 1-day timeframes. A collection can use one timeframe for every symbol or store a separate timeframe for each symbol.
Does Pineify Screener support stocks and crypto?
Yes. The supported universe includes US stocks, major and actively monitored crypto pairs, index and sector ETFs, and additional market instruments that have current Pineify screener coverage.
Where does the technical data come from?
The Screener displays indicator and market values reported through Pineify's TradingView Alert pipeline. The app treats those reported values as the source data rather than recalculating the indicators with a separate frontend formula.
How often does the Screener update?
The visible active collection requests updates every 60 seconds. Manual refresh has a short cooldown. Request time is not the timestamp of a new market observation.
Can I create my own collections?
Yes. Expert users can create, rename, reorder, and delete collections; add and manage symbols; choose indicators; and configure the timeframe model. Pineify supports up to 15 collections per user.
Can Pineify Screener create trading alerts?
The current Create Alert control displays a Coming Soon notice and does not create a running alert. No release date is established here.