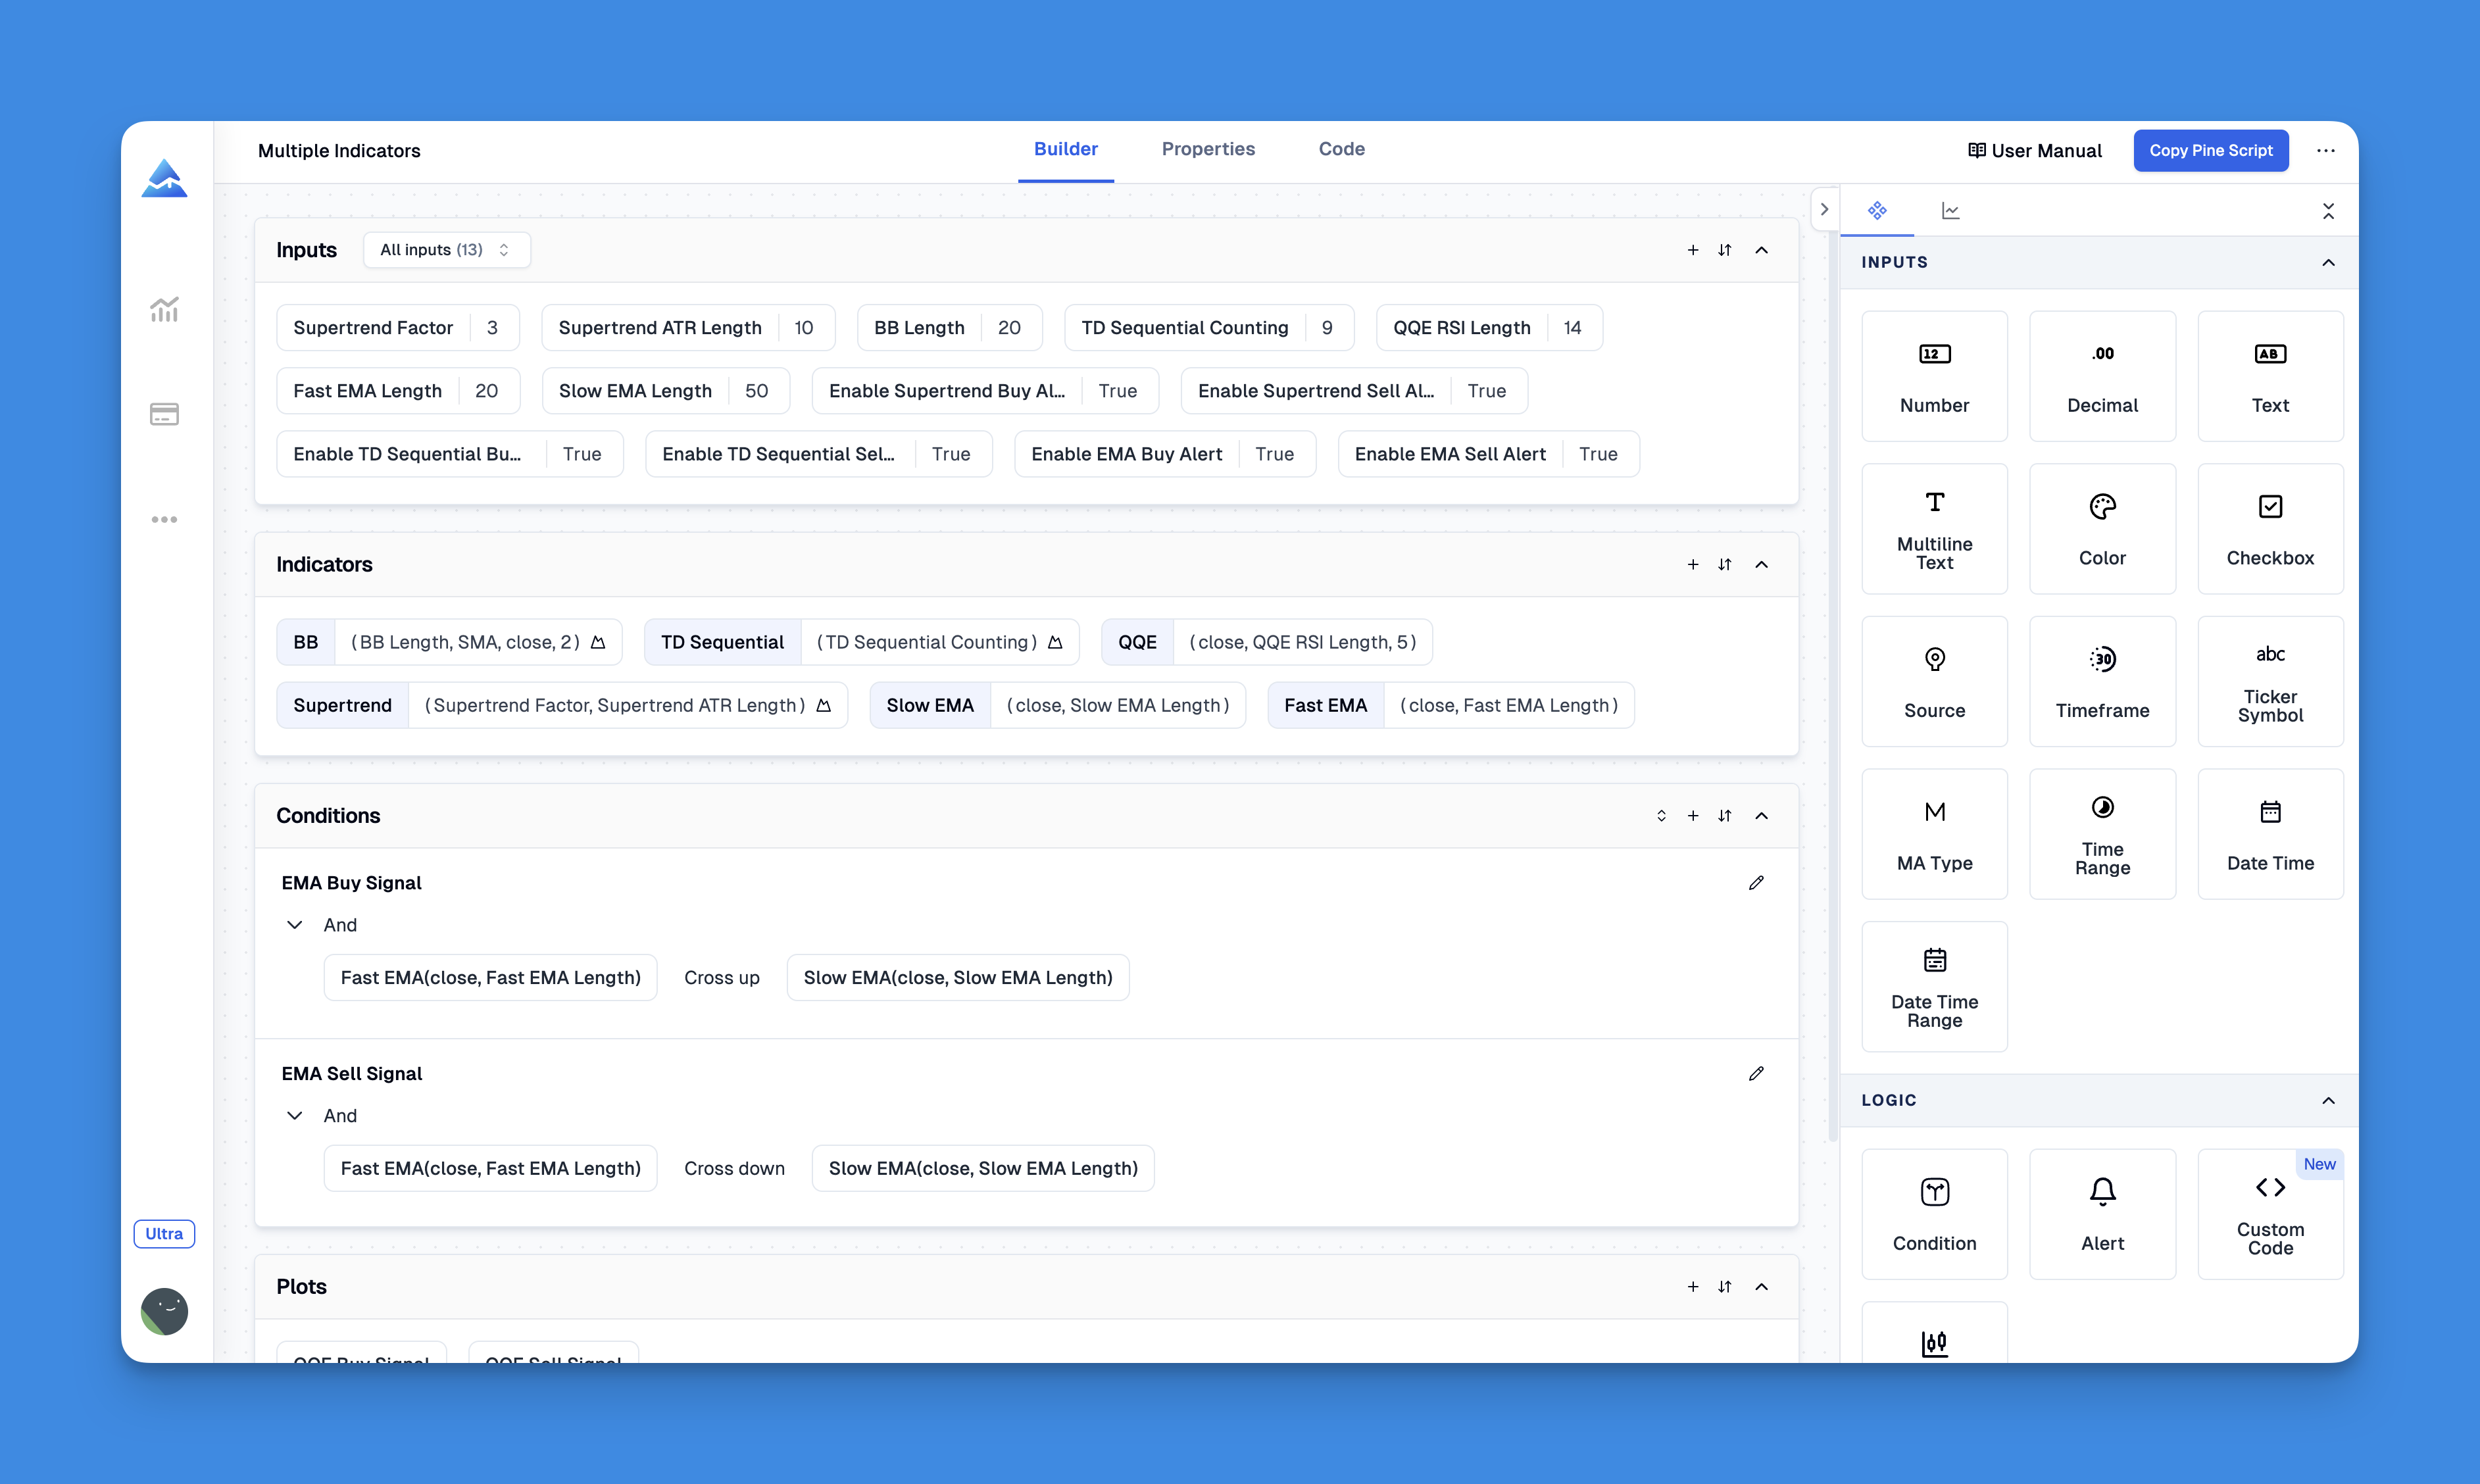
Pineify helps turn indicator and strategy rules into Pine Script through a visual builder and AI-assisted coding. The useful question is whether the generated script implements your rules correctly on TradingView. “Best,” guaranteed first-pass compilation and a fixed time saving are not established by this introduction.
TradingView is a charting and analysis platform, not a broker. Its broker integrations let you submit and manage supported orders through the TradingView interface, while the connected broker provides the trading account and execution service. Check the broker's legal entity and terms separately from TradingView's subscription.
Check the official TradingView status page for current incidents, then identify which function is failing: charts, data, login, alerts or a broker connection. This article is a troubleshooting workflow, not a live assertion that TradingView is up or down.
TradingView is worth paying for when a specific plan feature solves a recurring task you cannot handle adequately with your current tools. It is not automatically worth more because you trade more often, and a subscription does not establish a trading edge. Start with the chart, alert, data and testing requirements you can actually name.
The Kairi Relative Index (KRI) measures percentage distance from a moving average. A positive value means the selected price is above that average; a negative value means it is below. It does not establish that a stretched price must return to the average.
Kavout and Pineify both offer AI-assisted financial research. Comparing Kavout as only a static US-stock score dashboard with Pineify as the only conversational option misstates the current products. The useful comparison is the research task, source coverage and entitlement you can verify in each account.
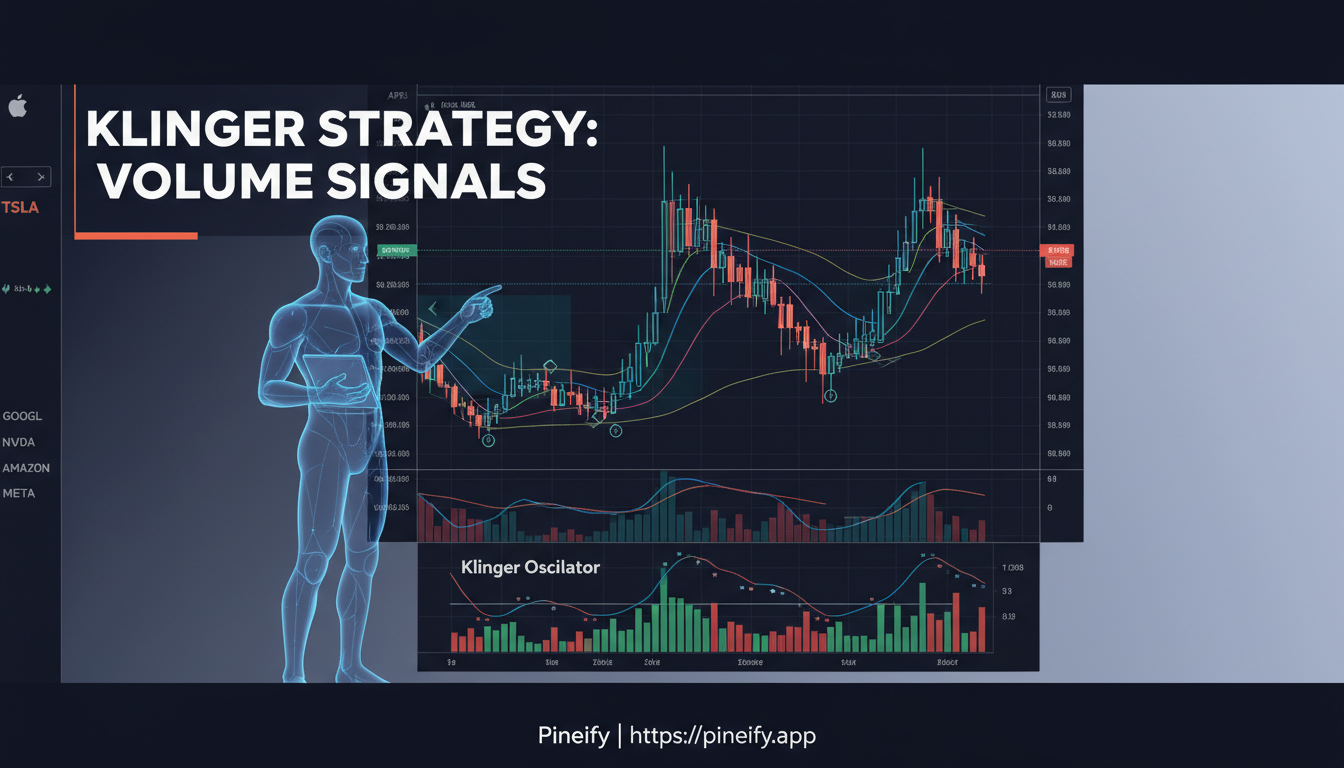
A Klinger Oscillator strategy needs an exact indicator implementation and explicit trading rules. The oscillator transforms price and volume; it does not directly separate buyer-initiated from seller-initiated transactions or identify institutional money moving into an asset.
Pine Script is TradingView's language for indicators, strategy simulations, and alert conditions. A useful first project is a moving-average crossover: calculate two series, draw them, define an event, and inspect when it becomes known. An indicator signal and a simulated order are different outputs, so this guide provides a separate example for each.
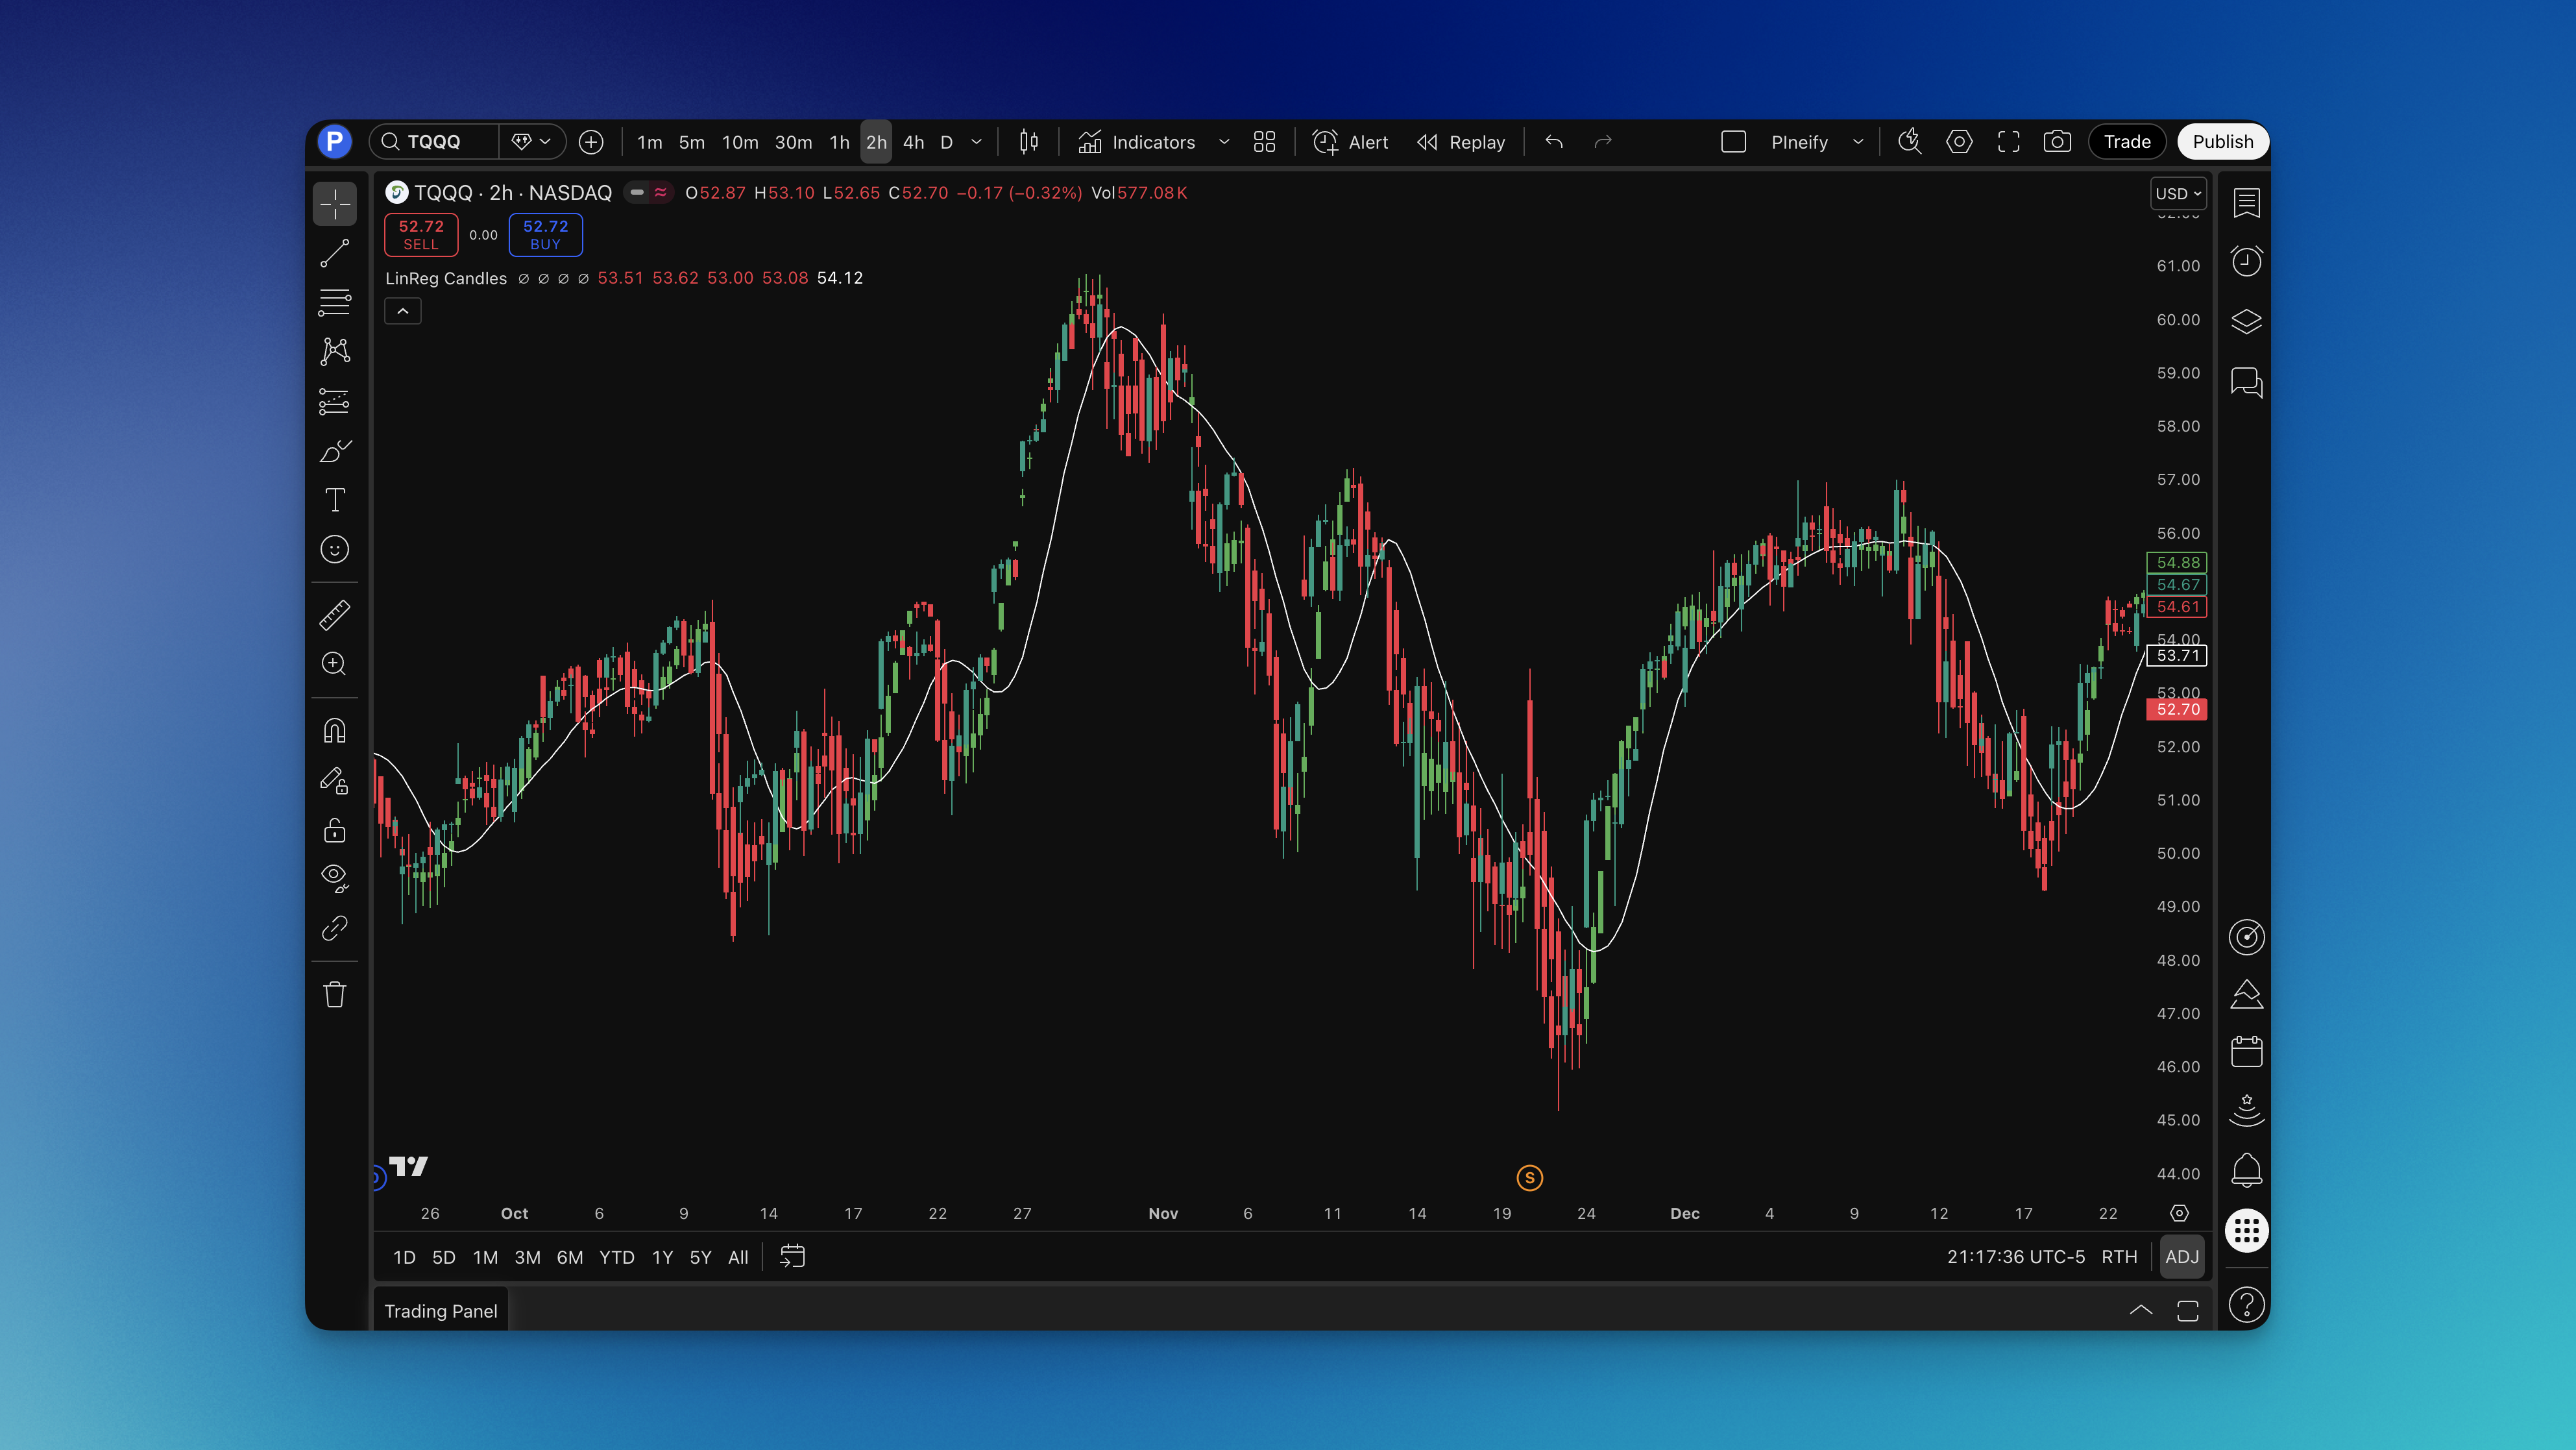
Linear Regression Candles replace the displayed open, high, low, and close with values fitted over a rolling window. The resulting candles can help you inspect changes in a fitted price series, but they are calculated values rather than prices available for execution. A trading rule must distinguish the transformed chart from the actual market prices used for orders.
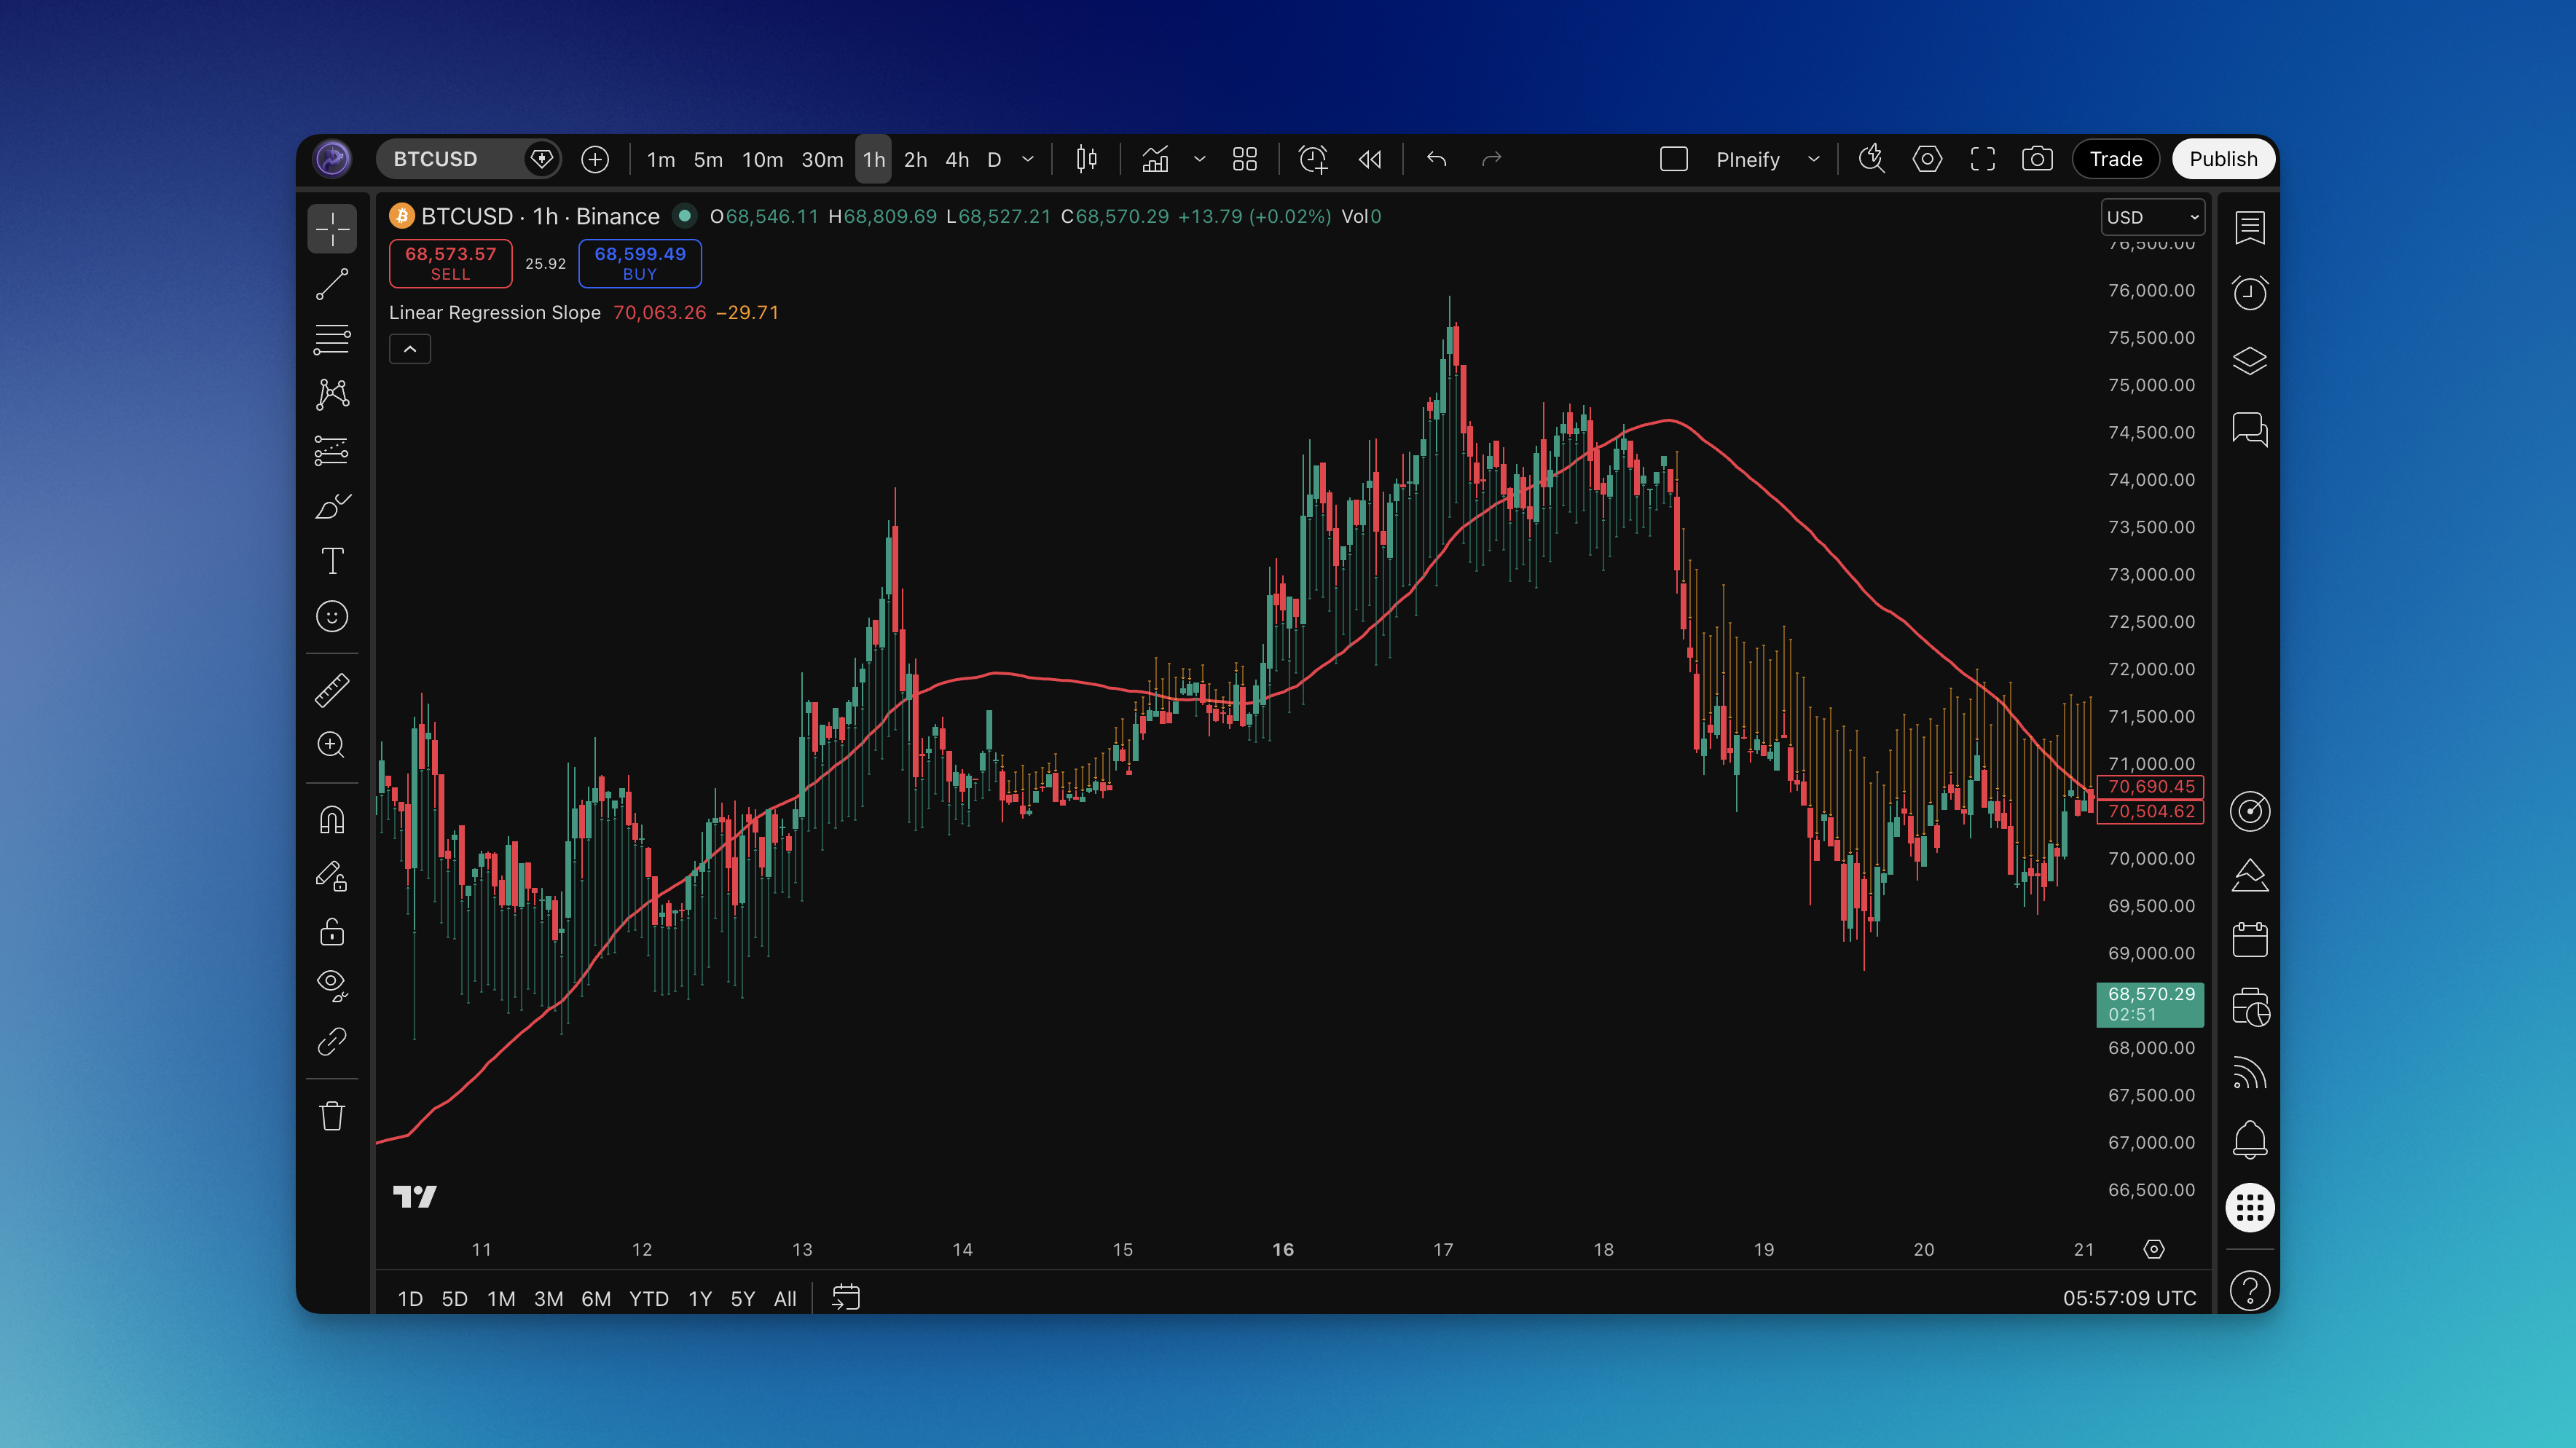
Pineify's Linear Regression Slope component measures the bar-to-bar change in a rolling regression endpoint. That is an important distinction: its output is not the slope coefficient of a single fitted window. Understanding the actual calculation prevents a chart label from becoming an unsupported claim about trend strength or future returns.