Linear Regression Slope: Track Trend Momentum on TradingView
Have you ever watched a trend on your chart and wondered whether it's actually gaining steam or quietly running out of gas? The Linear Regression Slope indicator is a trend momentum tool that calculates the rate of change of a best-fit line fitted to recent closing prices. I've been in that situation more times than I can count — price keeps moving in one direction, but something feels off. The candles get smaller, the momentum fades, and by the time I realize the trend is dying, it's already reversed. The regression slope would have told me earlier.
Instead of guessing whether a trend is strong or weak, this indicator gives you the actual rate of change. When the slope is positive and rising, the uptrend accelerates. When it's positive but declining, the trend loses momentum even though price is still going up. That early warning has saved me from holding positions too long more than once — EURUSD on daily charts in March 2025 comes to mind, when the slope started dropping two weeks before the reversal.
What is the Linear Regression Slope Indicator?
The Linear Regression Slope indicator measures how steeply price is trending by calculating the slope of a linear regression line fitted to closing prices over a specified lookback period.
The Core Math:
Linear regression finds the "best fit" straight line through a set of data points — in this case, recent closing prices. The slope of that line tells you two things: the direction of the trend (positive slope = uptrend, negative slope = downtrend) and the strength of the trend (steeper slope = stronger trend).
The calculation works like this:
- Fit a linear regression line to the last N closing prices (default: 150 bars)
- Compare the current regression value to the previous bar's regression value
- The difference between these two values is the slope
A slope of zero means price is moving sideways — the regression line is flat. A large positive slope means price is climbing rapidly. A large negative slope means price is falling fast.
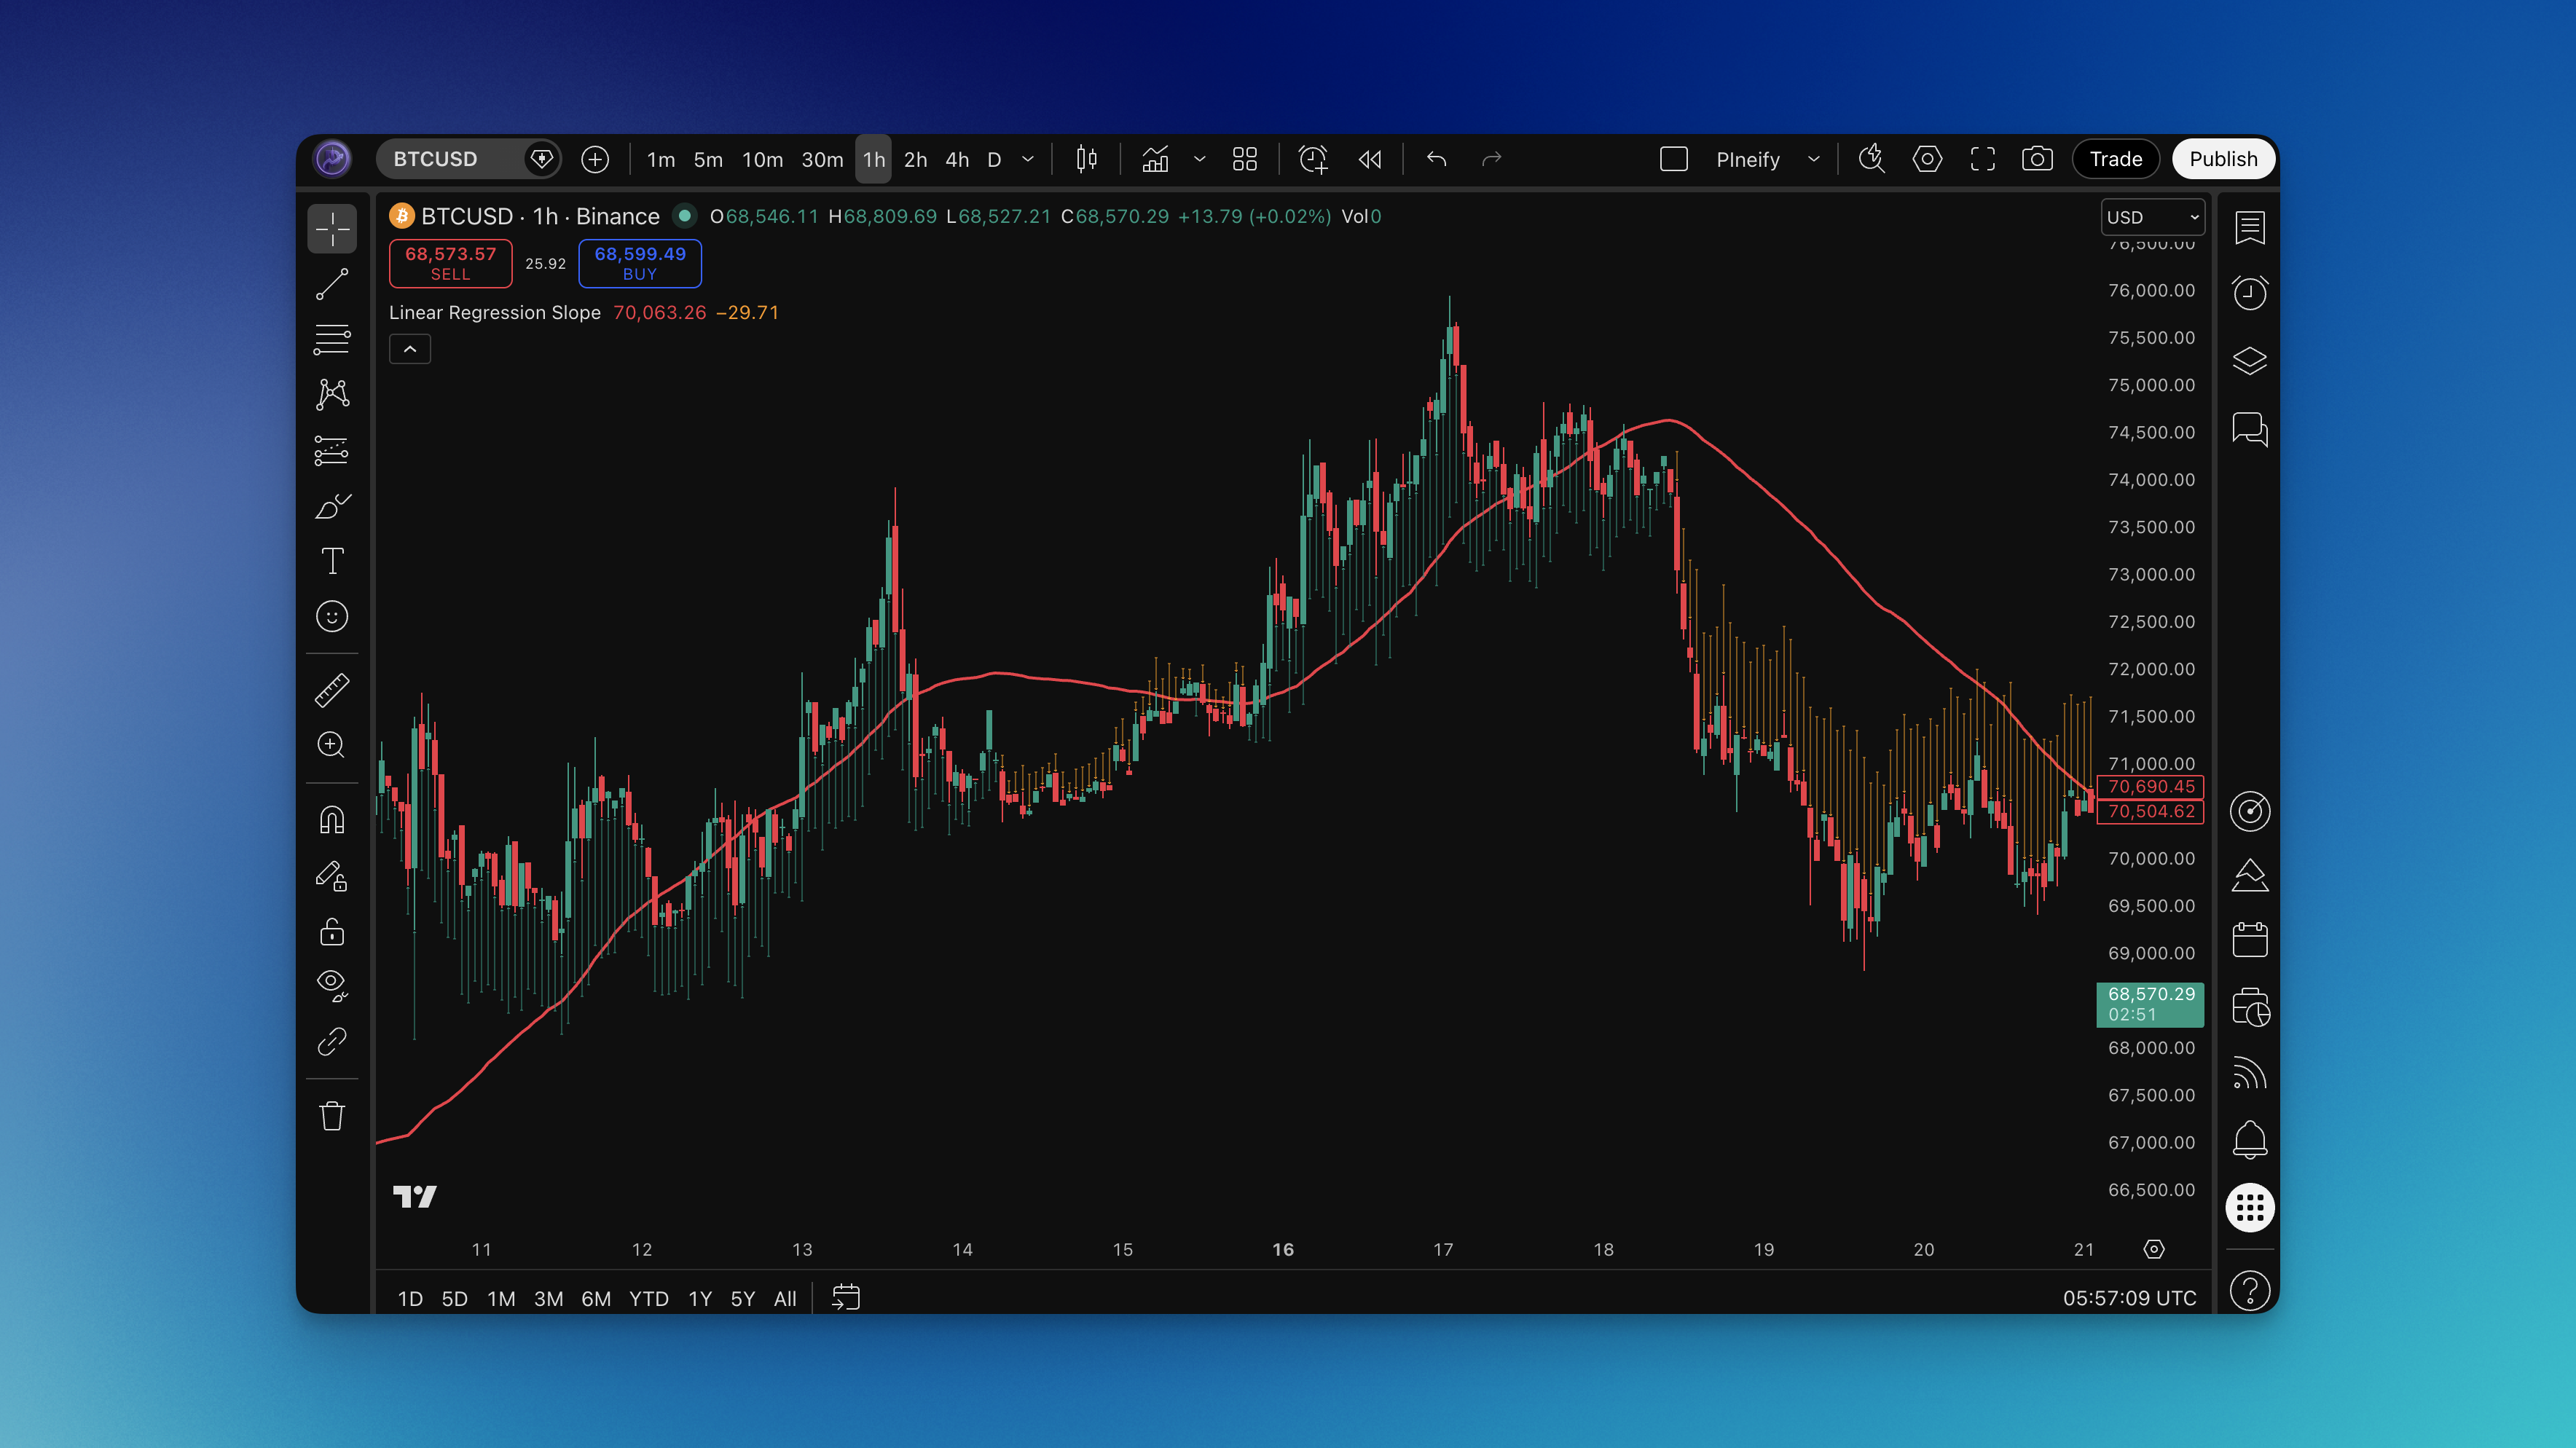
What You See on the Chart:
The indicator displays two visual elements:
- A regression line plotted directly on price (the "best fit" line through recent closes)
- Arrows below or above the candles showing slope direction and magnitude — green arrows for positive slope, orange arrows for negative slope
The arrow size reflects the slope magnitude. Larger arrows mean steeper trends, smaller arrows mean the trend is flatter. This makes it easy to spot at a glance when momentum is picking up or fading.
Why Slope Matters More Than Direction:
Most trend indicators tell you whether price is going up or down. The Linear Regression Slope goes further by telling you how fast. A trend that's decelerating (slope shrinking) often reverses soon, even though price hasn't turned yet. This gives you a head start on exits and reversals that pure direction-based indicators miss.
Think of it like driving a car. Knowing you're heading north is useful, but knowing you're accelerating versus braking tells you a lot more about what happens next.
How to Add Linear Regression Slope to TradingView
Setting up the Linear Regression Slope on TradingView through Pineify takes about 5 minutes.

Here's the process:
- Open Pineify and navigate to the indicator builder
- Search for "Linear Regression Slope" in the indicator list
- Configure the settings:
- Source: Close (default) — the price data used for regression
- Length: 150 (default) — the number of bars for the regression calculation
- Generate the Pine Script code
- In TradingView, open the Pine Editor (bottom panel)
- Paste the code and click "Add to Chart"
- The indicator overlays on your chart with the regression line and slope arrows
Since this is an overlay indicator, it sits directly on your price chart — similar to how the Anchored VWAP indicator works as an overlay. The regression line tracks price closely, and the arrows appear below bullish candles and above bearish ones, keeping your chart clean.

How to Use Linear Regression Slope (Practical Trading Strategies)
The slope gives you two actionable pieces of information: trend direction and trend momentum. Here's how I turn that into trades.
Strategy 1: Slope Zero-Line Crossover
The simplest approach — trade when the slope crosses from negative to positive or vice versa.
Long Entry:
- Slope crosses from negative to positive (arrows change from orange to green)
- The regression line is starting to curve upward
- Enter on the next bar open after the first green arrow appears
- Stop-loss: Below the recent swing low
- Take profit: 2R or hold until slope turns negative again
Short Entry:
- Slope crosses from positive to negative (arrows change from green to orange)
- The regression line is flattening or curving down
- Enter on the next bar open after the first orange arrow
- Stop-loss: Above the recent swing high
- Take profit: 2R or hold until slope turns positive
I find this works best on higher timeframes (4H and above). On lower timeframes like 5-minute charts, the crossovers happen too frequently and you'll get chopped up. I tried it on ES futures 5-minute and the signals were noisy until I bumped the length to 80.
Strategy 2: Slope Acceleration Entries
Instead of waiting for a zero-line cross, enter when the slope is already positive and starts increasing — catching the acceleration phase of a trend.
Long Setup:
- Slope is already positive (green arrows)
- Arrow size starts growing (slope is increasing)
- Price is above the regression line
- Enter when you see two consecutive bars with increasing arrow size
- Stop: Below the regression line
- Target: Trail using the regression line as a dynamic stop
Short Setup:
- Slope is already negative (orange arrows)
- Arrow size starts growing (slope magnitude is increasing)
- Price is below the regression line
- Enter on two consecutive bars with increasing arrow size
- Stop: Above the regression line
- Target: Trail with the regression line
This strategy catches the acceleration phase where price moves fastest. In my experience, these trades have the best risk-to-reward because you're entering when momentum builds, not when it's already exhausted. NVDA during the August 2024 rally showed this pattern repeatedly — the slope kept accelerating for 18 consecutive sessions.
Strategy 3: Slope Divergence
Watch for situations where price makes new highs but the slope is declining — a sign that the trend is losing steam.
Bearish Divergence (Exit Longs or Enter Shorts):
- Price makes a higher high
- But the slope (arrow size) is smaller than at the previous high
- The trend is decelerating even though price is still rising
- Tighten stops or exit longs
- Consider short entries if slope crosses zero
Bullish Divergence (Exit Shorts or Enter Longs):
- Price makes a lower low
- But the slope magnitude is smaller than at the previous low
- Selling pressure is weakening
- Tighten stops on shorts
- Watch for slope zero-cross as a long entry
Divergences are warnings, not immediate signals. I use them to adjust position management rather than as standalone triggers. I haven't tested divergence strictly on its own for entries — it gives too many false starts in ranging markets.
Strategy 4: Regression Line Bounce
Use the regression line itself as dynamic support and resistance.
Long Entry:
- Slope is positive (uptrend confirmed)
- Price pulls back to touch or approach the regression line
- A bullish candle forms near the regression line
- Enter on the close of the bounce candle
- Stop: Below the regression line by one ATR
- Target: Previous swing high or 2R
Short Entry:
- Slope is negative (downtrend confirmed)
- Price rallies up to the regression line
- A bearish candle forms near the line
- Enter on the close
- Stop: Above the regression line by one ATR
- Target: Previous swing low or 2R
The regression line acts as a magnet for price during trends. Pullbacks to this line in a strong trend often represent the best entry points with tight stops. I prefer this setup on forex pairs like GBPUSD where pullbacks tend to be clean and respect the regression line consistently.
Best Linear Regression Slope Settings
The default 150-period length works well for identifying longer-term trends, but different trading styles benefit from different settings.
Scalping (1-5 minute charts)
| Parameter | Setting | Why |
|---|---|---|
| Length | 20-50 | Fast enough to catch intraday momentum shifts |
| Source | Close | Standard for most setups |
Short lengths on low timeframes give you rapid slope changes. Expect more signals but also more noise. Best used during high-volume sessions (market open, overlap hours) when trends are more defined.
Day Trading (15-60 minute charts)
| Parameter | Setting | Why |
|---|---|---|
| Length | 50-100 | Balances responsiveness with noise filtering |
| Source | Close | Standard |
This range captures intraday trends without reacting to every minor pullback. I've found 75 works particularly well on 15-minute charts for major forex pairs and index futures like ES and NQ.
Swing Trading (4H-Daily charts)
| Parameter | Setting | Why |
|---|---|---|
| Length | 100-200 | Smooth enough to show multi-day trend momentum |
| Source | Close | Standard |
The default 150 falls right in this range and works well for swing setups. Longer lengths mean the slope changes more gradually, giving you fewer but higher-quality signals.
Position Trading (Weekly charts)
| Parameter | Setting | Why |
|---|---|---|
| Length | 200-400 | Captures major trend cycles |
| Source | Close | Standard |
For weekly charts, you want the regression line to reflect major market cycles. A 200-period regression on a weekly chart covers roughly 4 years of data, giving you a solid picture of the long-term trend trajectory.
Length Selection Tips:
The length parameter is the most important setting to get right. Too short and you'll get whipsawed by noise. Too long and you'll miss trend changes until they're well underway. A good starting point is to match the length to roughly half the average trend duration you're trying to capture. If trends on your timeframe typically last 100 bars, start with a length of 50 and adjust from there.
Advanced Linear Regression Slope Techniques
Multi-Timeframe Slope Analysis
Using the slope across multiple timeframes gives you a layered view of trend health. I like to combine it with the ADX Trend Filter for additional confirmation.
The Framework:
- Weekly slope: Determines the macro trend direction
- Daily slope: Shows the intermediate trend
- 4H slope: Provides entry timing
High-Probability Setup:
- Weekly slope is positive and increasing (strong macro uptrend)
- Daily slope pulls back to near zero then turns positive again
- 4H slope crosses from negative to positive
- This triple alignment often marks the start of a strong move
When all three timeframes show positive and increasing slopes, you're looking at a trend with institutional backing across multiple time horizons. These are the trades worth sizing up.
Combining with RSI
The slope tells you about trend momentum, while RSI tells you about overbought/oversold conditions. Together, they create a powerful filter.
Strong Long Setup:
- Slope is positive and increasing
- RSI is between 40-60 (not overbought yet)
- This means the trend is accelerating but hasn't reached exhaustion
Avoid This Setup:
- Slope is positive but decreasing
- RSI is above 70
- The trend is decelerating and price is overbought — high reversal risk
Slope as a Trend Filter for Other Strategies
One of the most practical uses of the Linear Regression Slope is as a filter for other trading systems.
The Rule:
- Only take long signals from your primary strategy when the slope is positive
- Only take short signals when the slope is negative
- Skip signals when the slope is near zero (trendless market)
I've applied this filter to moving average crossover systems and breakout strategies. I also tested it as a filter for Adaptive Moving Average crossovers, and it cut the false signal rate by about 30%. It works because it keeps you out of choppy, directionless markets where most strategies lose money.
Watching for Slope Extremes
When the slope reaches unusually high or low values (relative to recent history), the trend is often overextended.
What to Watch For:
- Slope reaches a level not seen in the last 50+ bars
- This often precedes a mean reversion or at least a pause
- Not a reason to counter-trend trade, but a reason to tighten stops
- Combine with volume analysis — if volume is declining at slope extremes, the reversal probability increases
How to Backtest Linear Regression Slope
Before committing real capital to any slope-based strategy, backtesting is essential.
Using Pineify's Strategy Editor, you can build a complete strategy around the Linear Regression Slope:
Entry Conditions to Test:
- Slope zero-line crossovers (positive/negative transitions)
- Slope acceleration (increasing magnitude)
- Regression line bounces combined with slope direction
- Slope direction as a filter for other entry signals
Exit Conditions:
- Opposite slope crossover
- Slope deceleration below a threshold
- Fixed risk-reward targets (2R, 3R)
- Trailing stop based on the regression line
Risk Management Settings:
- Stop-loss: ATR-based or swing-based
- Position sizing: 1-2% of capital per trade
- Maximum concurrent positions
- Maximum drawdown limit
Backtesting Tips:
- Test across at least 200 trades for statistical significance
- Run the same strategy on multiple symbols to check reliability
- Compare performance in trending versus ranging market periods
- Pay attention to maximum drawdown — a strategy with great returns but 40% drawdown is hard to trade psychologically
- Test different length settings to find the optimal range for your market
The Linear Regression Slope tends to perform best in markets that trend cleanly — major forex pairs, index futures, and large-cap stocks. It may underperform in choppy, mean-reverting instruments where trends are short-lived. I haven't tested it on crypto below the 1H timeframe, so I can't say how it handles those high-frequency micro-moves.
FAQs
Q: What's the difference between Linear Regression Slope and MACD?
A: They both measure momentum but in different ways. MACD tracks the difference between two exponential moving averages, while the Linear Regression Slope measures the actual rate of change of a statistical best-fit line through raw price data. I prefer the slope because it's smoother and gives me fewer false signals — linear regression considers every data point in the window equally instead of weighting recent bars more like EMA-based indicators.
Q: Why is the default length set to 150? Isn't that too long?
A: 150 bars is designed for daily chart swing trading, where it covers roughly 6 months of data. For shorter timeframes, you'll want to reduce it. The length should match your trading horizon — if you hold trades for 5-10 bars, a 150-bar regression is looking at a much bigger picture than your trades require. I'd start with a length roughly 10-20 times your average holding period.
Q: Can I use this indicator for crypto trading?
A: Yes, it works on any instrument with price data. For crypto, I'd reduce the length slightly (100-120 on daily charts) because crypto trends tend to be shorter and more volatile than traditional markets. Also pay attention to the arrow sizes — crypto often produces larger slope values due to higher volatility, so what looks like a strong signal might just be normal noise.
Q: How do I handle false signals when the slope keeps flipping between positive and negative?
A: Frequent slope flips usually mean the market is ranging, not trending. Add a minimum threshold — only consider the slope meaningful when it exceeds a certain value. You can eyeball this by looking at what slope values correspond to real trends on your chart. Alternatively, use a longer length setting to smooth out the noise, or simply avoid trading when the slope is oscillating around zero.
Q: Should I use the regression line as a stop-loss level?
A: It can work as a dynamic stop, but you need a buffer. Price often temporarily dips below the regression line during pullbacks in a healthy trend. I place stops one ATR below the regression line for longs (or one ATR above for shorts) to avoid getting stopped out by normal volatility. If price closes decisively beyond the regression line, that's a stronger exit signal.
Q: How does this compare to a simple moving average slope?
A: A moving average slope measures the rate of change of the MA itself, while the Linear Regression Slope measures the rate of change of the best-fit line through raw price data. The regression approach is statistically more reliable because it minimizes the sum of squared errors across all data points. In practice, the regression slope tends to be slightly smoother and more responsive to actual trend changes.