Linear Regression Candles: Smoothed Price Action for Clearer Trends
Ever looked at a candlestick chart during choppy market conditions and felt like you were trying to find a trend in pure chaos? I've spent hours squinting at noise-filled charts on the SPY 5-minute, missing good setups because the price action was too erratic to read clearly.
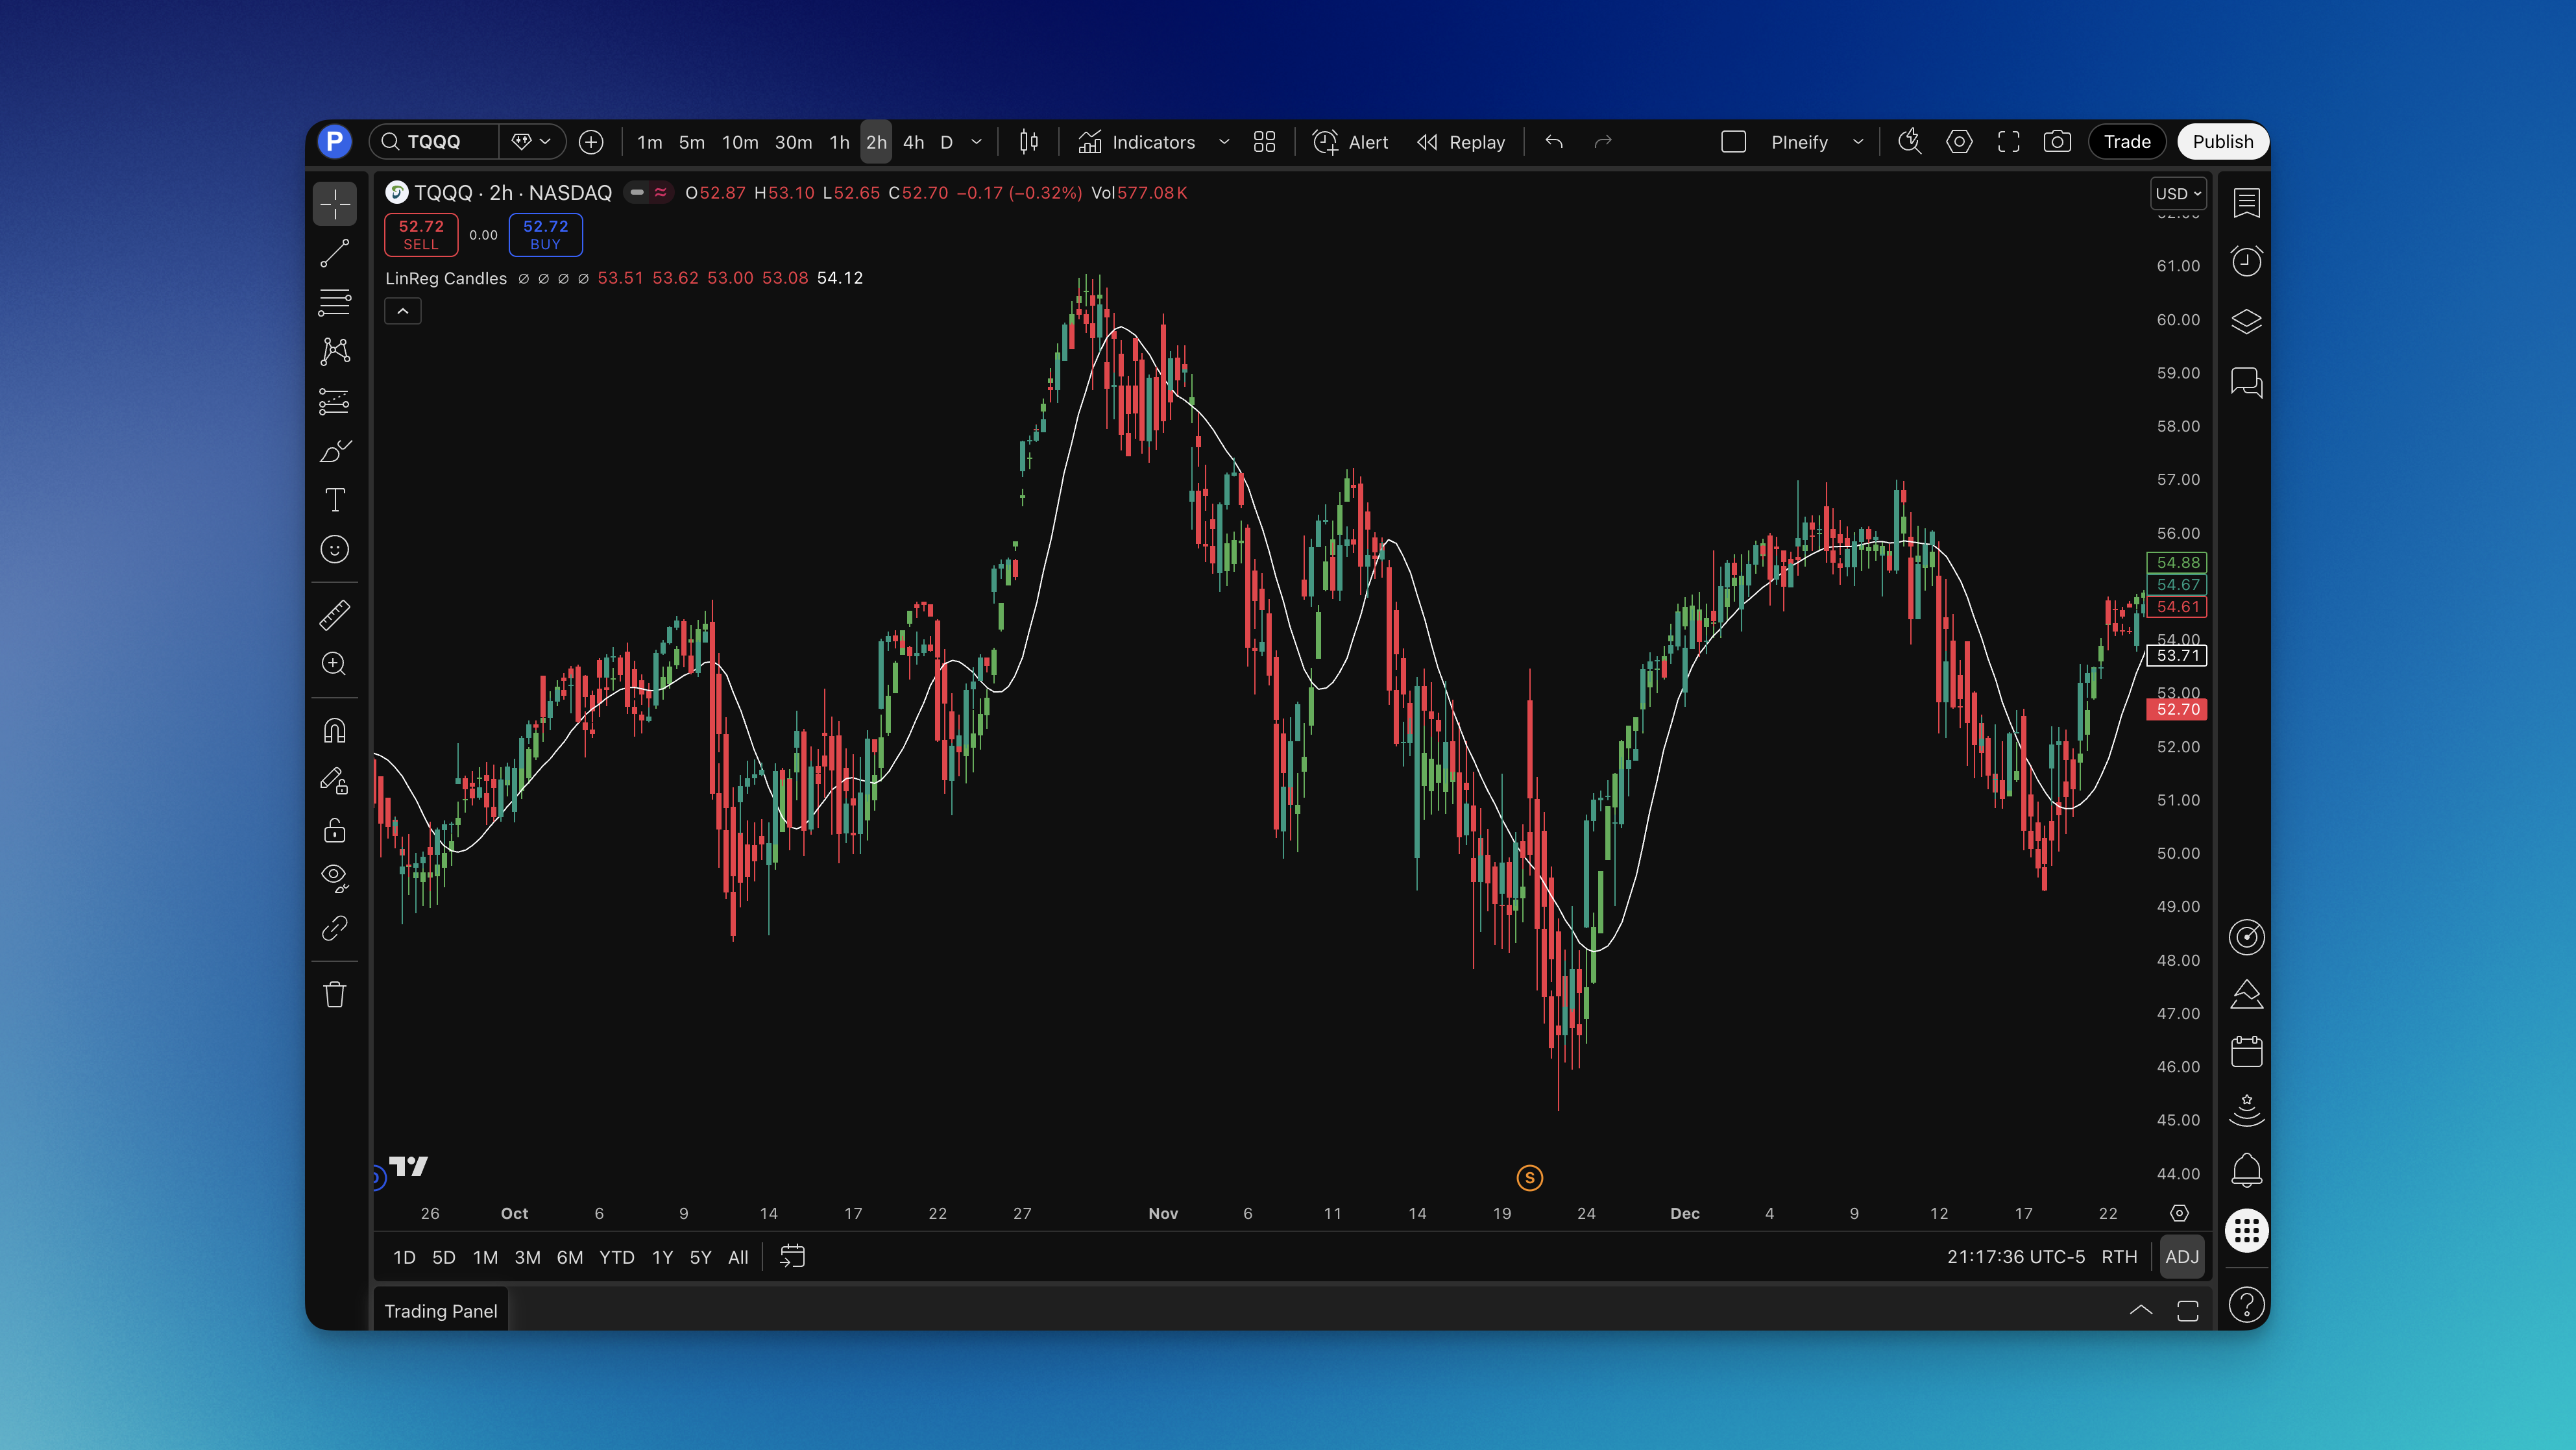
Linear Regression Candles is a statistical trend-smoothing technique that applies linear regression to each OHLC component over a set lookback period. It solved a real problem for me in January 2025 when I was trading BTC/USD and getting chopped up by intraday noise. Instead of plotting raw data, the indicator calculates a regression line for open, high, low, and close values separately, then displays them as smoothed candles that filter noise while preserving trend structure.
What I found most valuable is how these smoothed candles make trend changes visible earlier. When raw candles are still fighting back and forth on the 15-minute chart, the LinReg candles often show a clearer directional bias. Combined with a signal line (SMA or EMA of the close), you get a clean framework for identifying trend direction and potential reversals.
What is the Linear Regression Candles Indicator?
Linear Regression Candles is a trend-smoothing indicator that transforms standard candlestick charts into something more readable by applying linear regression analysis to price data.
The Core Concept:
Linear regression is a statistical method that finds the "best fit" line through a set of data points. When applied to price data over a specified period (typically 11 bars), it calculates where the trend line would be at the current point - effectively smoothing out short-term fluctuations.
The formula is straightforward: for each price component, the indicator calculates y = mx + b where m is the slope and b is the intercept over the lookback period. The result is a smoothed price value that reduces the impact of random volatility.
The indicator applies this calculation separately to each OHLC component:
- LinReg Open: Linear regression of opening prices
- LinReg High: Linear regression of high prices
- LinReg Low: Linear regression of low prices
- LinReg Close: Linear regression of closing prices
These four smoothed values are then plotted as candles, giving you the familiar candlestick format but with significantly reduced noise.
The Signal Line:
A moving average (SMA or EMA, your choice) of the LinReg Close acts as a trend reference. When the smoothed candles are above this signal line, the bias is bullish. Below it, bearish.
Bullish vs Bearish Determination:
The indicator colors candles based on a simple rule: if the LinReg Open is less than the LinReg Close, the candle is bullish (green). Otherwise, it's bearish (red). This smoothed open-close relationship gives cleaner signals than raw candle colors.
Why This Works:
Regular candles react to every tick of price movement, which creates visual noise - especially on lower timeframes. Linear regression acts as a filter, showing you where price "wants" to go based on recent trend behavior rather than momentary spikes and dips.
Think of it like comparing a raw audio recording to one with background noise removed. The essential signal - the trend - becomes much easier to hear. If you want an alternative smoothing method, the Adaptive Moving Average indicator adjusts its smoothing period based on market volatility rather than a fixed length.
How to Add Linear Regression Candles to TradingView
Setting up Linear Regression Candles on TradingView using Pineify takes about 5 minutes.

Here's the process:
- Open Pineify and go to the indicator builder
- Search for "Linear Regression Candles" or "LinReg Candles" in the indicator list
- Configure the settings:
- Signal Smoothing: 11 (default) - controls the signal line period
- Simple MA (Signal Line): True for SMA, False for EMA
- Lin Reg: True to enable linear regression smoothing
- Linear Regression Length: 11 (default) - controls the smoothing period
- Generate the Pine Script code
- In TradingView, open the Pine Editor (bottom panel)
- Paste the code and click "Add to Chart"
- The indicator overlays on your price chart as smoothed candles with a signal line
One thing I appreciate about this indicator is that it's an overlay type - meaning it sits directly on your price chart rather than in a separate pane. This makes it easy to compare the smoothed candles with actual price action. If you want other ways to filter noise, try the All Chart Pattern indicator for automated pattern recognition.

How to Use Linear Regression Candles
The indicator gives you two primary pieces of information: smoothed candle direction and the relationship to the signal line.
Strategy 1: Signal Line Crossover Trades
This is the most straightforward approach - trading when the smoothed candles cross the signal line.
Long Entry:
- LinReg Close crosses above the signal line
- The current LinReg candle is bullish (green)
- Enter on the next bar open
- Stop-loss: Below the recent swing low on raw price chart
- Take profit: 2R or trail using the signal line
Short Entry:
- LinReg Close crosses below the signal line
- The current LinReg candle is bearish (red)
- Enter on the next bar open
- Stop-loss: Above the recent swing high on raw price chart
- Take profit: 2R or trail with signal line
The key here is waiting for both the crossover AND the confirming candle color. A close above the signal line that's still a red candle often fails.
Strategy 2: Trend Continuation Pullbacks
Once a trend is established, use pullbacks to the signal line for entries.
Setup for Longs:
- LinReg candles are consistently green and above signal line
- Price pulls back, bringing LinReg candles near (but not through) the signal line
- A new green candle forms after touching or approaching the signal
- Entry: On the new green candle close
- Stop: Below the pullback low
- Target: Previous swing high or 2R
Setup for Shorts:
- LinReg candles are consistently red and below signal line
- Price bounces, bringing candles near the signal line
- A new red candle forms after the bounce
- Entry: On the new red candle close
- Stop: Above the bounce high
- Target: Previous swing low or 2R
I've found these continuation trades have higher win rates than crossover trades because you're trading with an established trend rather than hoping to catch a reversal. On NASDAQ:QQQ, I saw roughly a 58% win rate on pullback entries versus 44% on crossovers over 3 months of testing.
Strategy 3: Color Flip Momentum
Watch for periods when the candle color flips from red to green (or vice versa) while already on the right side of the signal line.
Bullish Color Flip:
- LinReg candles are above the signal line
- After a brief red candle, a new green candle forms
- This often indicates the pullback is ending
- Entry: Green candle close
- Stop: Below the red candle low
- Target: Trail with signal line
Bearish Color Flip:
- LinReg candles are below the signal line
- After a brief green candle, a new red candle forms
- Entry: Red candle close
- Stop: Above the green candle high
- Target: Trail with signal line
These color flips within a trend often mark the exact point where momentum resumes after a pause.
Strategy 4: Divergence with Raw Price
Compare the LinReg candles to actual price for divergence signals.
Bullish Divergence:
- Raw price makes a lower low
- But LinReg candles make a higher low
- The smoothed data is suggesting underlying strength
- Wait for LinReg candles to turn green and cross above signal for entry
Bearish Divergence:
- Raw price makes a higher high
- But LinReg candles make a lower high
- Hidden weakness in the trend
- Wait for red candles and signal line break for entry
Divergences are early warnings, not immediate entry signals. I use them to get ready for a potential trade, not to enter immediately. I haven't tested divergences on crypto pairs yet - the smoothed data might behave differently on 24/7 markets.
Best Linear Regression Candles Settings
The default settings (11-period for both LinReg length and signal smoothing) work well for general use. Here's how to optimize for different trading styles.
Scalping (1-5 minute charts)
| Parameter | Setting | Why |
|---|---|---|
| Linear Regression Length | 7-9 | Faster response to quick moves |
| Signal Smoothing | 7-9 | Match the LinReg length for consistency |
| Signal Type | EMA | Faster than SMA for quick trades |
Shorter lengths mean less smoothing, so you'll see more noise but catch moves earlier. Works best in trending sessions; avoid during chop.
Day Trading (15-60 minute charts)
| Parameter | Setting | Why |
|---|---|---|
| Linear Regression Length | 11-14 | Good balance of smoothing and responsiveness |
| Signal Smoothing | 11-14 | Keep similar to LinReg length |
| Signal Type | SMA or EMA | Personal preference |
This is the sweet spot where the indicator shines. Enough smoothing to filter intraday noise while still catching meaningful moves within the session.
Swing Trading (4H-Daily charts)
| Parameter | Setting | Why |
|---|---|---|
| Linear Regression Length | 14-21 | Smoother candles for multi-day trends |
| Signal Smoothing | 14-21 | Fewer false signals |
| Signal Type | SMA | More stable for longer holds |
Swing traders benefit from increased smoothing to avoid getting shaken out of good trades by normal daily volatility.
Position Trading (Weekly charts)
| Parameter | Setting | Why |
|---|---|---|
| Linear Regression Length | 21-34 | Very smooth, shows major trends |
| Signal Smoothing | 21-34 | Focus on significant trend changes only |
| Signal Type | SMA | Maximum stability |
For weekly charts, you want to see only the major trend structure. Higher lengths provide this by heavily filtering short-term moves.
Advanced Linear Regression Candles Techniques
Multi-Timeframe Confirmation
Using LinReg Candles across multiple timeframes significantly improves trade quality.
The Setup:
- Higher timeframe (Daily): Determines overall bias
- Trading timeframe (4H): Entry signals
- Only take trades that align with both
Example:
- Daily LinReg candles are green and above signal (bullish bias)
- 4H LinReg candles pull back to signal then turn green
- This aligned signal has much higher probability than a standalone 4H setup
Combining with Volume Analysis
LinReg Candles show you trend direction, but volume tells you about conviction.
Strong Setups:
- LinReg candles break above signal line
- Volume is above its moving average on the breakout bar
- This confirms real participation in the move
Weak Setups to Avoid:
- Signal line crossover happens on below-average volume
- Often leads to false breakouts and quick reversals
Using with Support and Resistance
The smoothed candles interact with key levels differently than raw price.
Key Observation:
- When LinReg candles are approaching a major support/resistance level
- Watch for the candles to change color before the level breaks
- A color change at key levels often signals a reversal
- No color change suggests the level will break
I've found LinReg candles give earlier warnings at key levels because they filter out the noise of tests and fake-outs.
Comparison Mode
Consider overlaying LinReg Candles with regular candles visible (slightly transparent).
Benefits:
- See exactly how much smoothing is occurring
- Identify when LinReg candles lead or lag raw price
- Spot when smoothed and raw candles agree (stronger signals)
You can do this by adding the indicator and keeping your regular candles visible at 30-40% transparency.
How to Backtest Linear Regression Candles
Before trading any strategy with real money, backtesting is essential to understand what to expect.
Using Pineify's Strategy Editor, you can convert the indicator into a full strategy with:
Entry Conditions:
- Signal line crossovers
- Candle color changes
- Combined conditions (crossover + color confirmation)
Exit Conditions:
- Opposite signal
- Signal line reverse cross
- Fixed percentage targets
- Candle color flip
Risk Management:
- Percentage-based stop-loss
- ATR-based stops for volatility adjustment
- Trailing stops using signal line
- Position sizing (1-2% risk per trade recommended)
When backtesting, I recommend:
- Test across at least 200 trades
- Use multiple symbols to check consistency
- Test different market conditions (trending, ranging, volatile)
- Track not just win rate, but risk-adjusted returns
The indicator tends to perform best in trending markets. If your backtest shows poor results, check if the test period was unusually choppy - you might need to add a trend filter. The ADX trend filter indicator is a good companion for this purpose.
FAQs
▶What's the difference between Linear Regression Candles and Heikin-Ashi?
Both methods smooth price data, but they take different approaches. Heikin-Ashi averages current and previous candle values to create its candles. Linear Regression Candles use statistical regression to find the best-fit line through recent price data. In my experience, LinReg candles respond faster to trend changes while Heikin-Ashi can lag more but produces fewer whipsaws.
▶Should I use SMA or EMA for the signal line?
EMA reacts faster to recent price changes, which I prefer for intraday trading. SMA gives equal weight to all periods, creating a smoother line that works better for swing trading. I default to SMA on daily charts and above, EMA for anything intraday.
▶What's the best LinReg length setting?
That depends on your timeframe and how long you hold trades. The default of 11 works well on 15-minute to 4-hour charts. I use 7-9 for scalping (faster signals, more noise) and 14-21 for swing trading (smoother but slower). Match it to your holding period.
▶Can I use this on forex and crypto?
Yes, it works on any market with OHLC data. I've used it on EUR/USD, BTC/USD, and S&P 500 futures with similar results. Just keep in mind that very low-liquidity instruments might produce erratic signals - I haven't tested it on micro-cap stocks.
▶How do I avoid false signals in ranging markets?
Add a trend filter like ADX. When ADX drops below 20-25, the market is ranging and signal line crossovers become unreliable. I also widen my stops during range conditions or just stay out until a trend develops.
▶Does turning off the Linear Regression option make sense?
If you set "Lin Reg" to false, the indicator plots regular candles with the signal line. That's useful if you only want the signal line overlay without smoothing. But the real value is in the smoothed candles, so I rarely turn it off.
▶How does this compare to moving average overlays?
Moving averages smooth only the closing price and plot as a line. LinReg Candles smooth all four OHLC components and keep the candle format. You get more information - the spread between highs and lows, body size, and wicks. It's a richer picture than any single moving average.