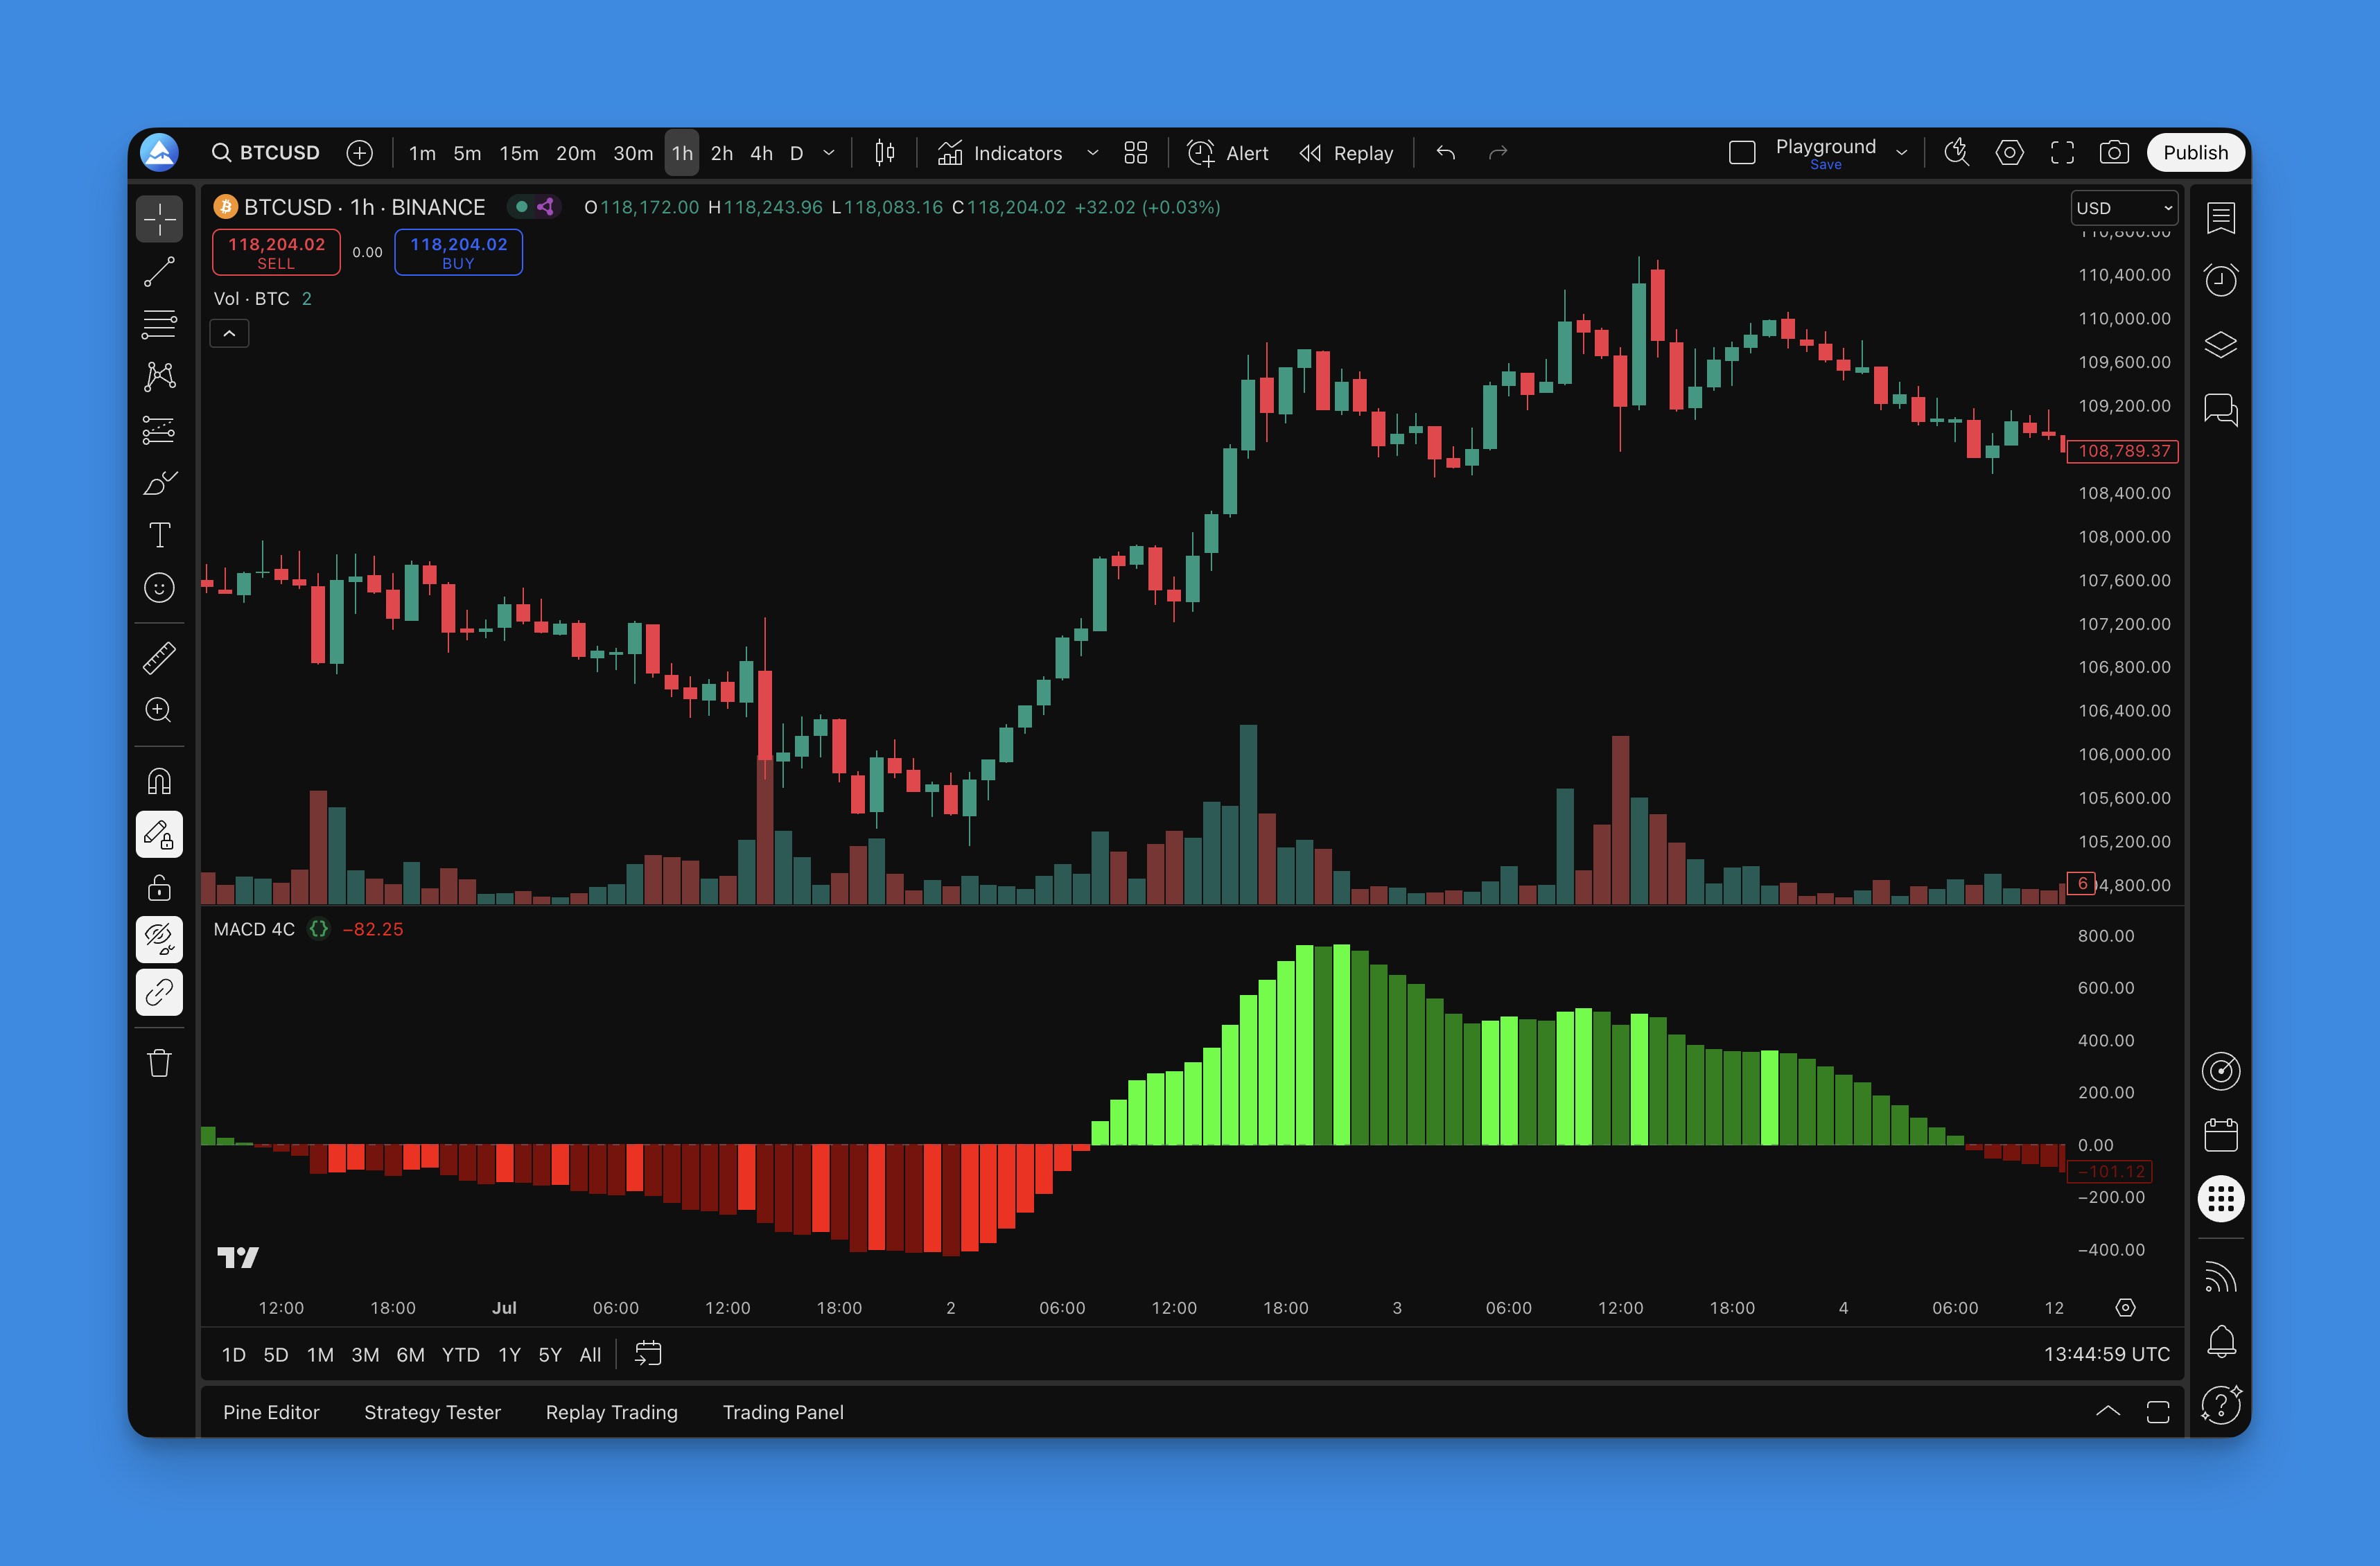
MACD 4C Indicator: Read Momentum Direction with Color-Coded Bars
Ever stared at a MACD histogram wondering if those bars mean buy, sell, or just wait? The MACD 4C indicator is a modified MACD histogram that uses four colors to show momentum strength and direction. It replaces the standard two-color system with bright green, dark green, red, and dark red bars — so you can see not just which side is winning, but how hard they're pushing.
How the MACD 4C Indicator Works
The MACD 4C indicator builds on the standard MACD formula:
MACD Line = 12-period EMA - 26-period EMA Signal Line = 9-period EMA of MACD Line Histogram = MACD Line - Signal Line
The 4C version adds one more layer to the histogram. Instead of coloring all positive bars green and all negative bars red, it checks whether momentum is accelerating or decelerating. That gives you four states:
- Bright Green: Bullish momentum accelerating — buyers are gaining strength
- Dark Green: Bullish momentum decelerating — still positive, but losing steam
- Red: Bearish momentum decelerating — sellers weakening, possible reversal forming
- Dark Red: Bearish momentum accelerating — sellers in full control
This color-coding skips the mental work of comparing bar heights or watching MACD line crossovers. One glance at the bar color tells you where momentum stands.
I've been using a version of this on my AAPL daily charts since September 2025, and the color transitions catch reversals earlier than the standard MACD alone. That said, I haven't tested it on crypto pairs, so I can't speak to how it behaves on Bitcoin or ETH.
If you want to combine this with crossover logic, check out our Pine Script MACD guide for signal line strategies.
How to Add MACD 4C to TradingView

Setting this indicator up takes a few minutes:
- Go to Pineify's indicator library and search for "MACD 4C"
- Adjust the parameters — the defaults (12, 26, 9) work for most traders
- Generate the Pine Script code
- Paste it into TradingView's Pine Editor, save, and apply to your chart
You'll see the four-color histogram appear immediately.
How to Use MACD 4C for Trading
Reading the four colors is straightforward:
- Bright Green bars: Strong upside momentum. I look for long entries here, especially if the color just shifted to bright green from dark green or red.
- Dark Green bars: Bullish momentum fading. On TSLA 1-hour charts in November 2025, dark green bars that persisted more than 5 candles often preceded a pullback.
- Red bars: Bearish momentum weakening. I watch these for potential long setups rather than opening shorts.
- Dark Red bars: Strong selling pressure. Don't try to catch a falling knife — wait for a transition.
Color transitions are where the real edge lives. A switch from dark red to red told me the sell-off was exhausting on NVDA during the October 2025 correction. I got into a long position two candles after the transition and caught a 4% bounce.
Zero line context matters too. Bright green bars above the zero line mean something different than bright green bars below it. Above zero in bright green confirms a strong bull trend. Below zero in bright green means buyers are fighting but haven't taken control yet.
For a broader toolkit, see our momentum indicator collection on Pineify.
Optimal Settings for Different Timeframes
Here's how I adjust the parameters based on what I'm trading:
| Trading Style | Parameters (Fast, Slow, Signal) | Best Timeframes |
|---|---|---|
| Scalping | 8, 17, 9 | 1-min to 15-min |
| Day Trading | 12, 26, 9 | 1-hour to 4-hour |
| Swing Trading | 14, 30, 9 | Daily to Weekly |
Market-specific tweaks:
- High volatility: Lengthen to 16, 35, 10 to filter out noise. I use this on earnings days.
- Strong trends: Stick with 12, 26, 9. If it's not broken, don't fix it.
- Choppy markets: Shorten to 10, 21, 7 for faster reversals. But honestly, no MACD variant works great in a range — I'd rather switch to a different tool.
I've tested these on SPY, QQQ, and individual stocks. The 8, 17, 9 scalping setup produces more signals but you'll get false positives. The 14, 30, 9 swing setup is cleaner but slower to react. Pick the trade-off that fits your style.
Backtesting MACD 4C Strategies
Here's the process I use when testing a new MACD 4C setup:
- Write entry rules, e.g. "enter long when bright green appears after at least 3 dark red bars"
- Set exit criteria — profit target at 2:1 risk/reward, stop loss when color shifts to red
- Test on at least 3 different tickers across different market conditions
- Track key metrics: profit factor, max drawdown, win rate
I ran a backtest on SPY from January to December 2025 using the default settings with a simple rule — buy on bright green, sell on dark green. The win rate came in around 44%, but the average winner was 1.8x the average loser. Not spectacular, but profitable.
The colors alone won't make you money. You need a full plan with risk management. Pair the MACD 4C with a trend filter indicator to avoid trading against the dominant trend.
▶What does the 4C in MACD 4C stand for?
Four Color. The indicator uses bright green, dark green, red, and dark red to represent how hard momentum is pushing in either direction. You get four distinct states instead of the standard two.
▶How is MACD 4C different from the standard MACD?
Standard MACD gives you one color for positive histogram bars and one for negative. MACD 4C splits each side into accelerating and decelerating momentum. So you can tell whether the bulls or bears are gaining or losing steam without looking at bar height changes.
▶What are the best MACD 4C settings for day trading?
I use 12, 26, 9 on 1-hour to 4-hour charts for normal day trading. For faster scalping, 8, 17, 9 works better. Test whatever you pick on the specific market you trade — I've found the defaults are a good starting point but they aren't magic.
▶How do I interpret color transitions in MACD 4C?
Transitions are where the signal lives. Dark red to red means selling pressure is easing — I watch for long entries. Bright green to dark green means buyers are running out of gas — that's a take-profit signal for me. The transition itself often precedes the actual price move by a few candles.
▶Can MACD 4C be used for swing trading?
Yes. I run 14, 30, 9 on daily and weekly charts. The longer parameters reduce noise and give you fewer, cleaner signals. It's not as responsive as the day-trading setup, but that's the point — swing trading doesn't need tick-by-tick reactions.
▶Does MACD 4C work in sideways or choppy markets?
Not really. Like any momentum oscillator, it struggles when price is going nowhere. Colors flip back and forth and you'll get whipsawed. I shorten the periods to 10, 21, 7 when stuck in a range, but honestly I'd prefer to use a different indicator entirely until a clear trend emerges.