Ever stared at a complex options strategy and wondered if it's ever actually worked for anyone? That's the exact question options backtesting software answers. It replays years of historical market data so you can test an idea before risking real capital. I've run through roughly a dozen platforms over the last three years, testing strategies on SPX, SPY, and QQQ. Here's what I've found: no single tool wins for everyone. The right pick depends on whether you want automation, manual replay, or free access to historical options chains.
Every trader knows that feeling — jumping into a falling market too early, or watching the perfect bottom pass by while you wait. The CM_Williams_Vix_Fix indicator was built for exactly this kind of timing. It's based on an idea from Larry Williams (the same trader who figured out how to replicate the VIX for any market) and later turned into a TradingView script by developer Chris Moody. I've been using it for about three years now on SPY and BTC daily charts, and I can tell you: it catches bottoms that most oscillators miss.
Order blocks are specific price zones where large financial institutions executed their trades. When price returns to these areas, it often reacts because unfilled institutional orders are still sitting there. My verdict after testing a dozen free options? Flux Charts Order Blocks gives you the most value for zero cost — it includes volumetric data, multi-asset scanning, and customizable invalidation logic that I haven't seen bundled in other free tools.
Order flow trading is a method that reveals the live battle between buyers and sellers behind every price movement. Instead of relying on lagging indicators that tell you what already happened, order flow shows you who's being more aggressive at each price level in real time. Most traders look at candles and think they see the story. But those candles are summaries — order flow is the raw footage. Understanding the imbalance between buying and selling pressure gives you a clearer read on where price might go next.
Pineify Signals and Overlays is a paid TradingView indicator that combines trend direction, momentum strength, and volatility assessment into one scoring system. Instead of stacking five separate tools and trying to reconcile conflicting signals, you get a single read on the market. I have been running it on my own charts, and the difference in screen clutter alone is worth the switch.
Pine Script backtesting is the process of testing trading strategies written in Pine Script against historical market data on TradingView. I've tested strategies across a dozen platforms over the past 3 years, and for TradingView users, Pineify is the tool I keep coming back to. Not because it's flawless — it doesn't support multi-asset portfolio backtesting yet — but because it cuts the coding overhead while keeping the analysis deep. You can build a strategy visually, run it against years of price data, and get institutional-grade metrics without opening a code editor.
Pine Script v6 is TradingView's scripting language for building custom indicators and trading strategies. I've been writing Pine Script for about two years, and this cheat sheet collects the operators, data types, and built-in functions I reference most. Whether I'm coding an RSI divergence scanner for AAPL or a trailing stop for ES futures, these are the fundamentals.
If you're wondering what language is Pine Script, it's TradingView's domain-specific scripting language for financial analysis and automated strategies.
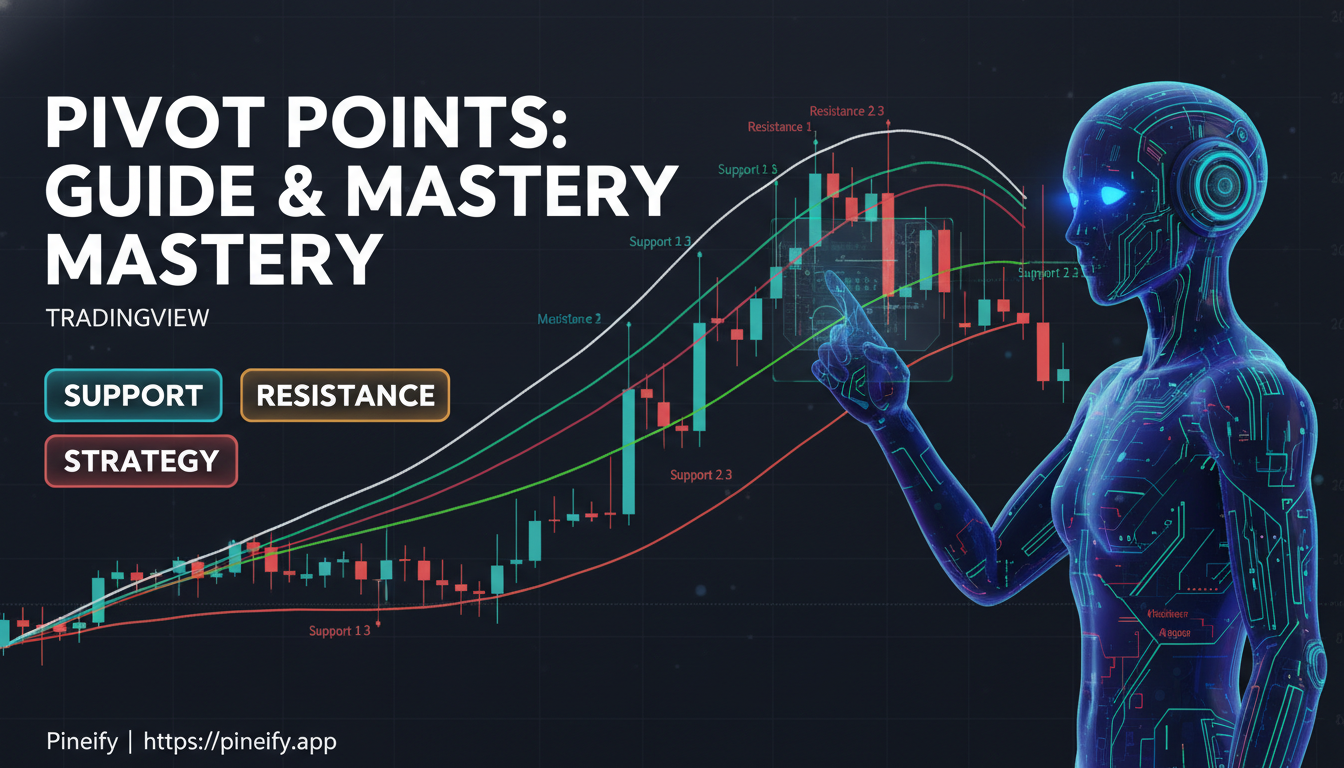
Pivot indicators are price-action tools that mark likely support and resistance levels based on historical highs and lows. Finding the right one on TradingView can sharpen your trading approach. These tools hand you clear zones for entry, exit, and stop-loss placement, helping you spot reversals before they happen.
No single Python backtesting library works for every trader. I've tested VectorBT, Backtrader, and a handful of others on real portfolios, and each one has sharp edges you only find after you commit. If you're coming from TradingView, the concepts on Pine Script optimization practices transfer directly to Python strategy logic. A Python backtesting library is a software toolkit that lets you simulate a trading strategy against historical price data before risking real money. If you need that verdict up front: VectorBT wins on speed, Backtrader wins on realism, and Backtesting.py wins on simplicity. Pick the one that matches where your bottleneck is.
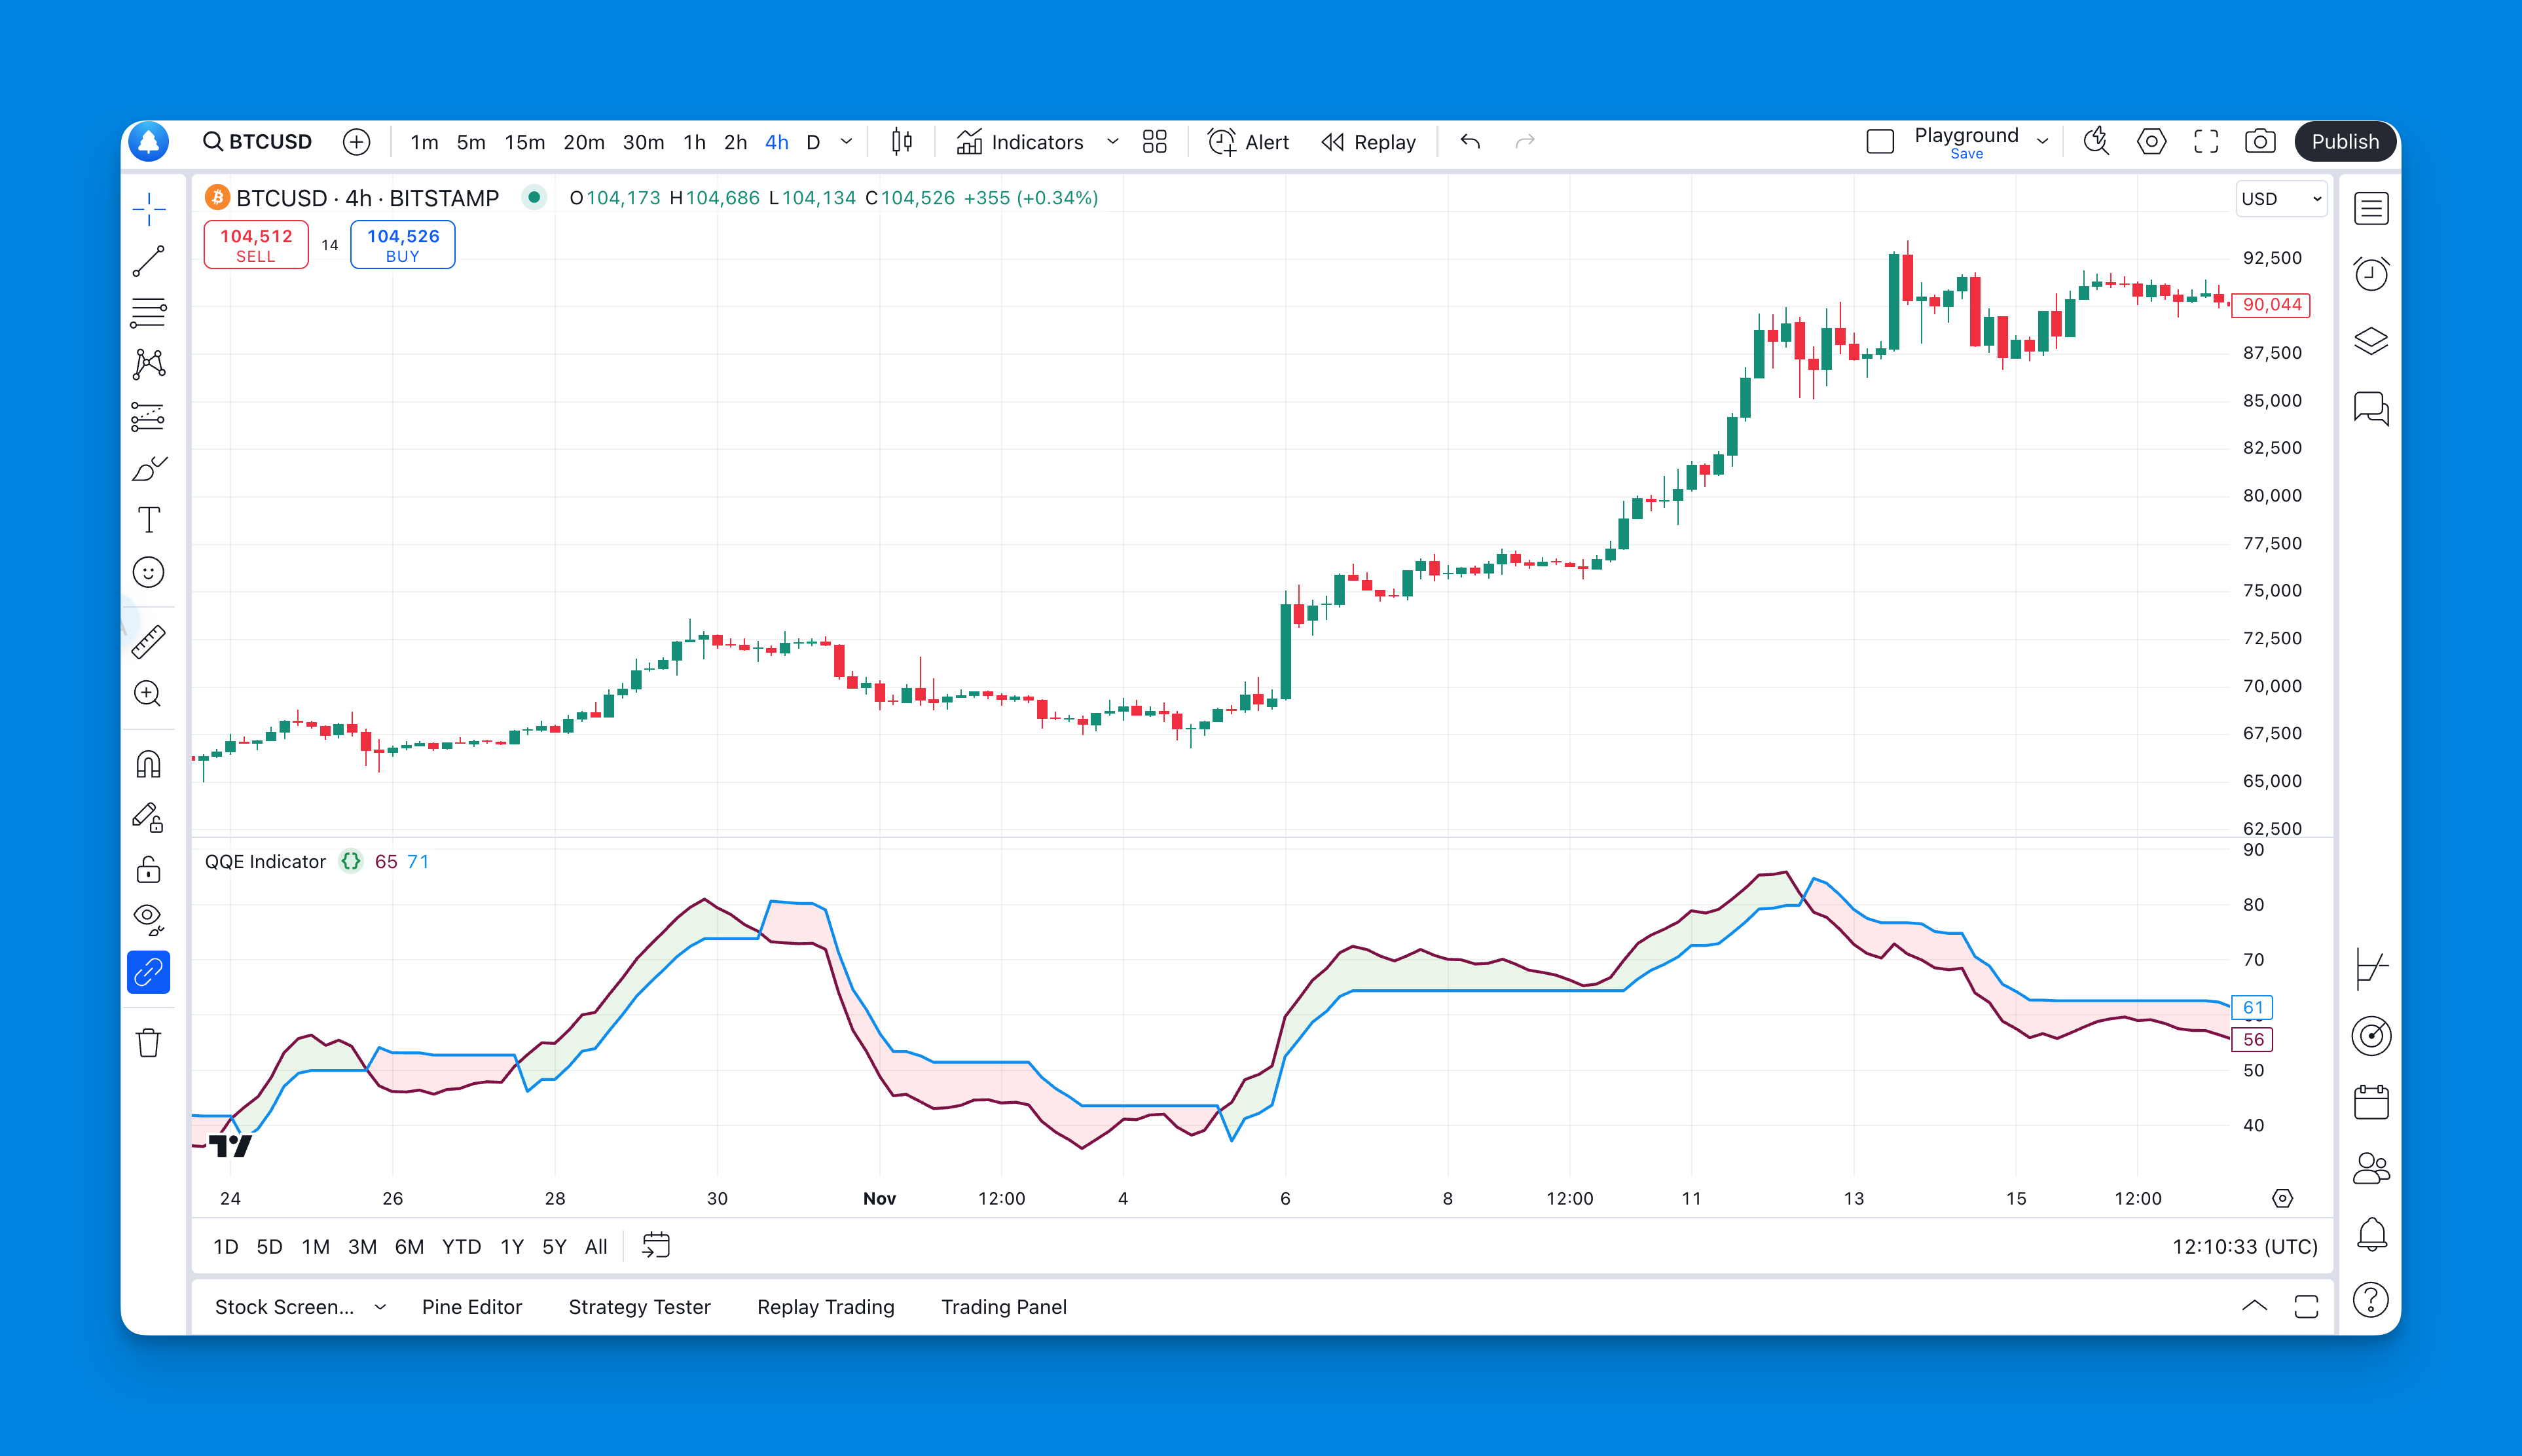
The QQE indicator is a momentum oscillator that smooths out RSI's rough edges to give you cleaner signals. I started testing it on SPY after getting burned by a false RSI reading in March 2025, and it surprised me how much the noise dropped. Before QQE, I'd watch RSI flip-flop between overbought and oversold while price just kept grinding sideways — that's where it fell apart for me.
You can find QQE pre-built on TradingView or build your own if you're comfortable with Pine Script. If you're not, tools like Pineify let you generate it without writing code.