Best Invite-Only TradingView Indicators for Backtested Signals
· 13 min read
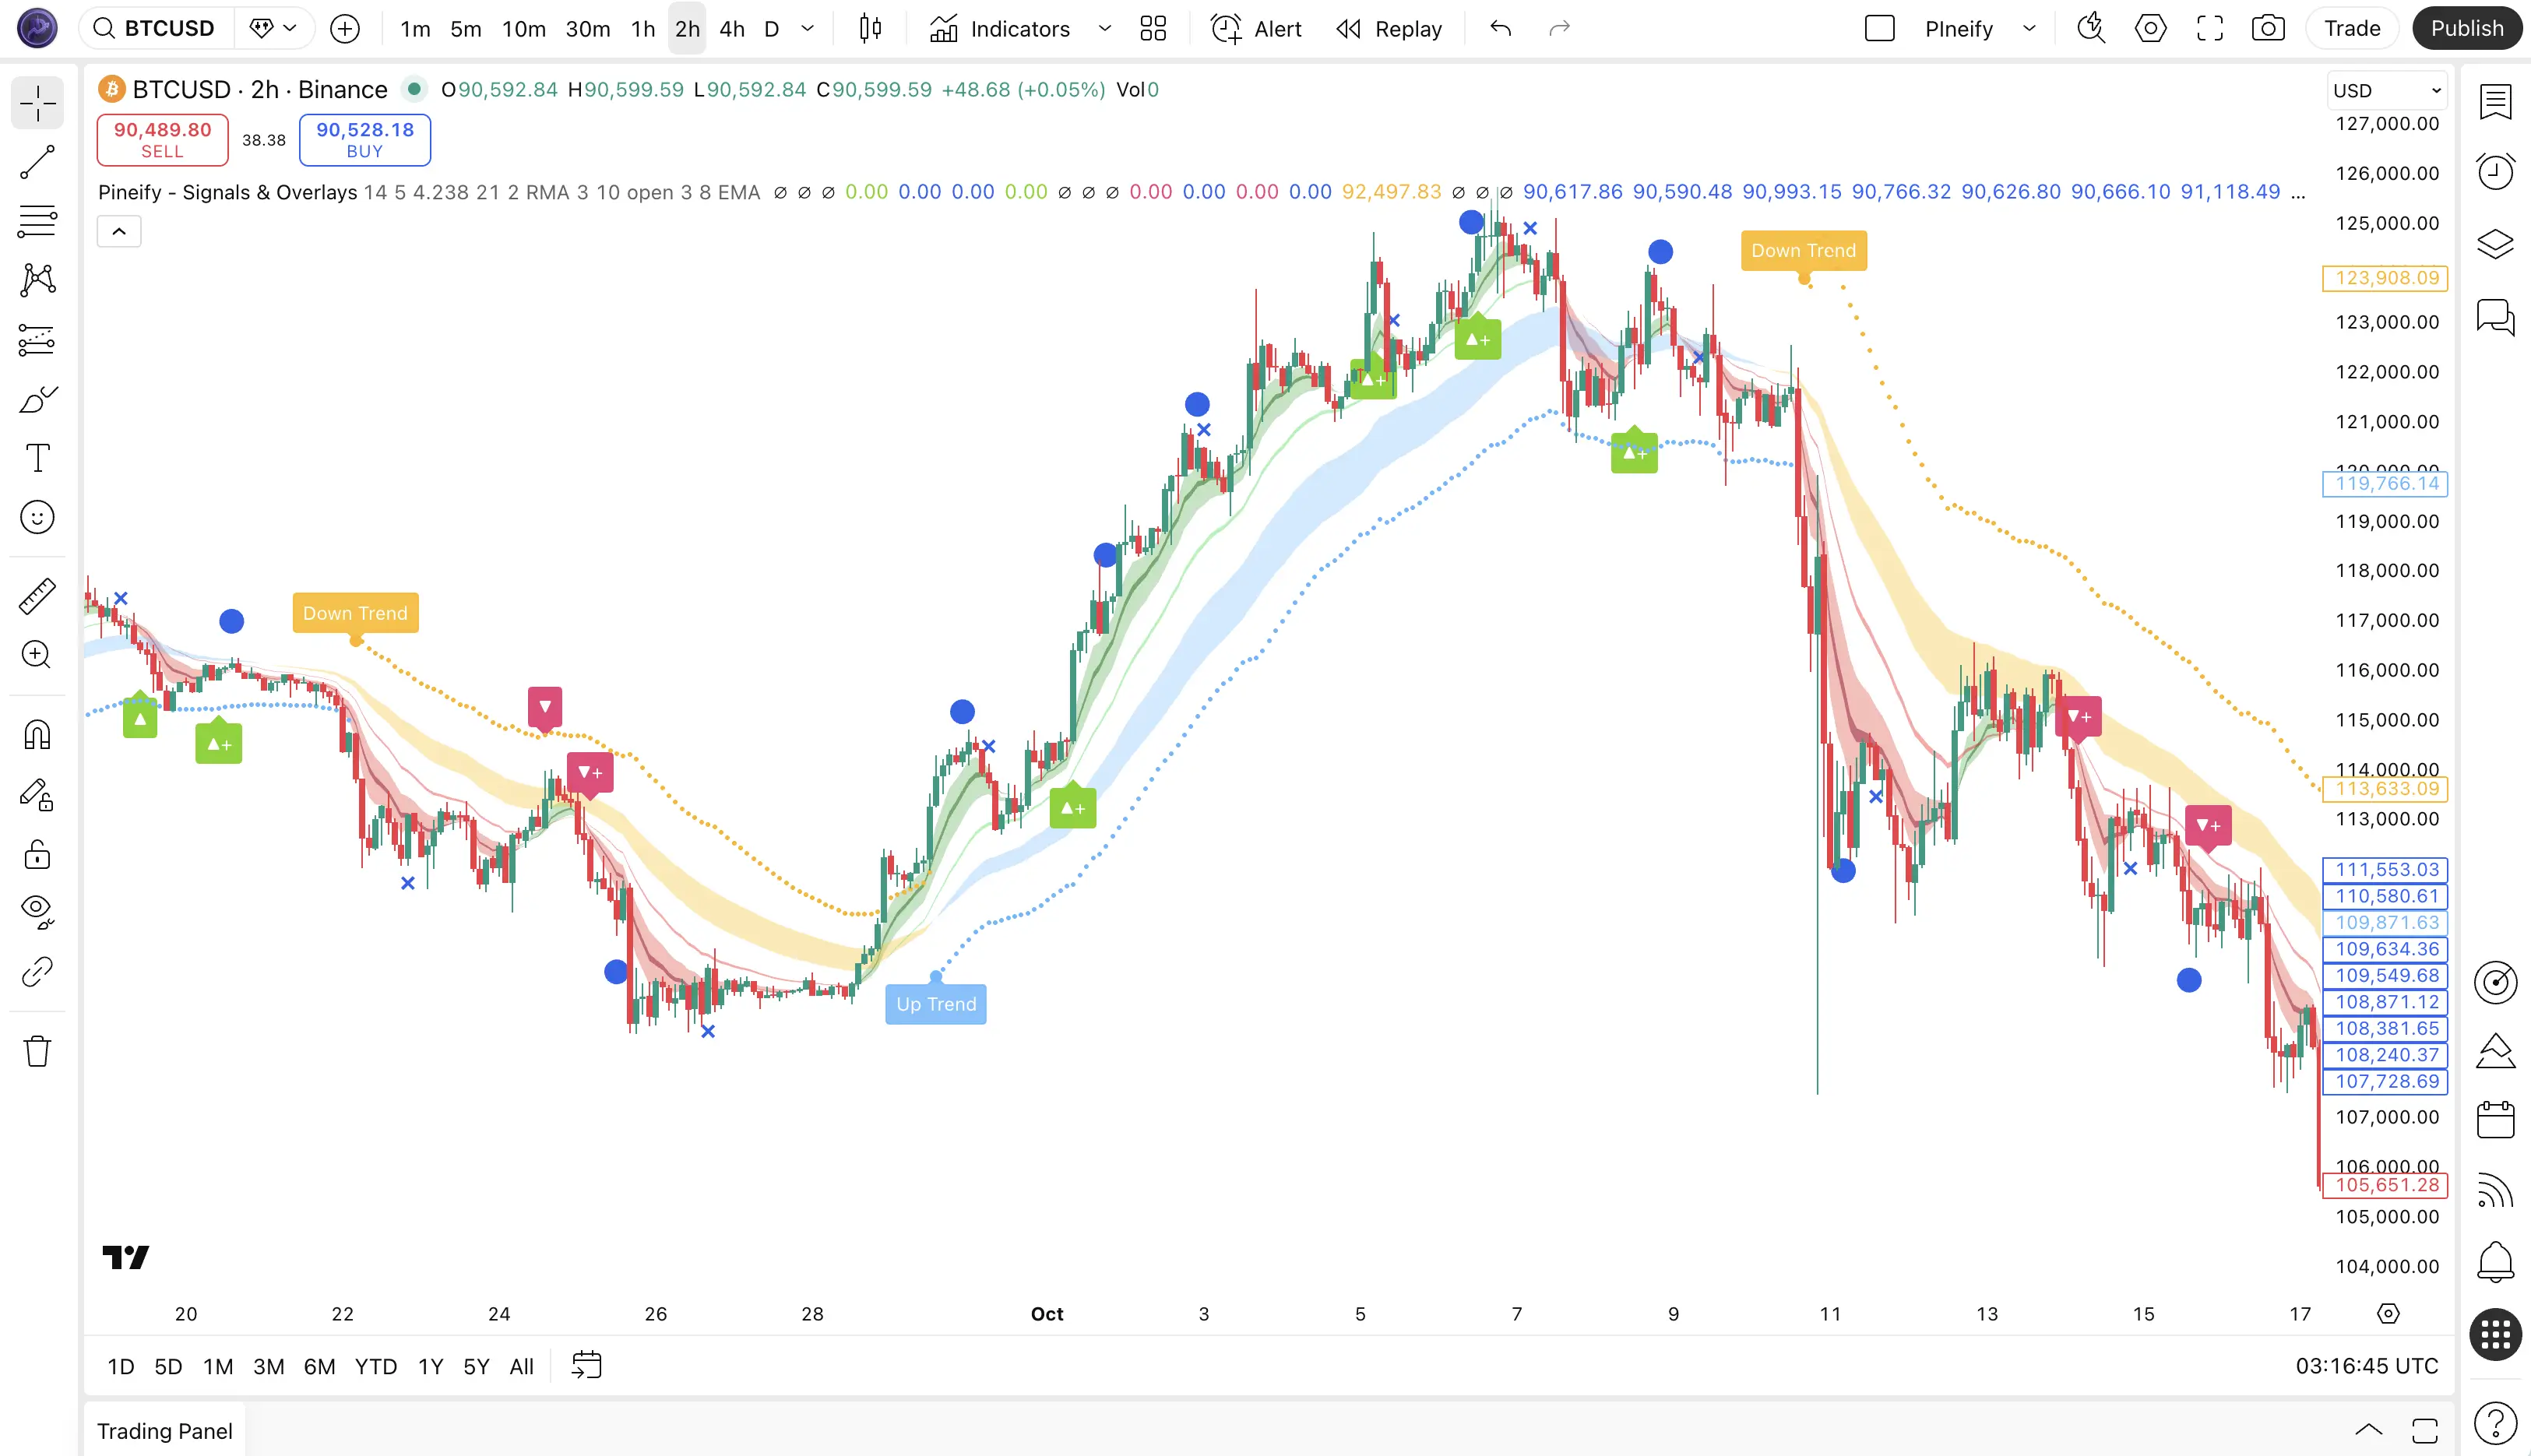
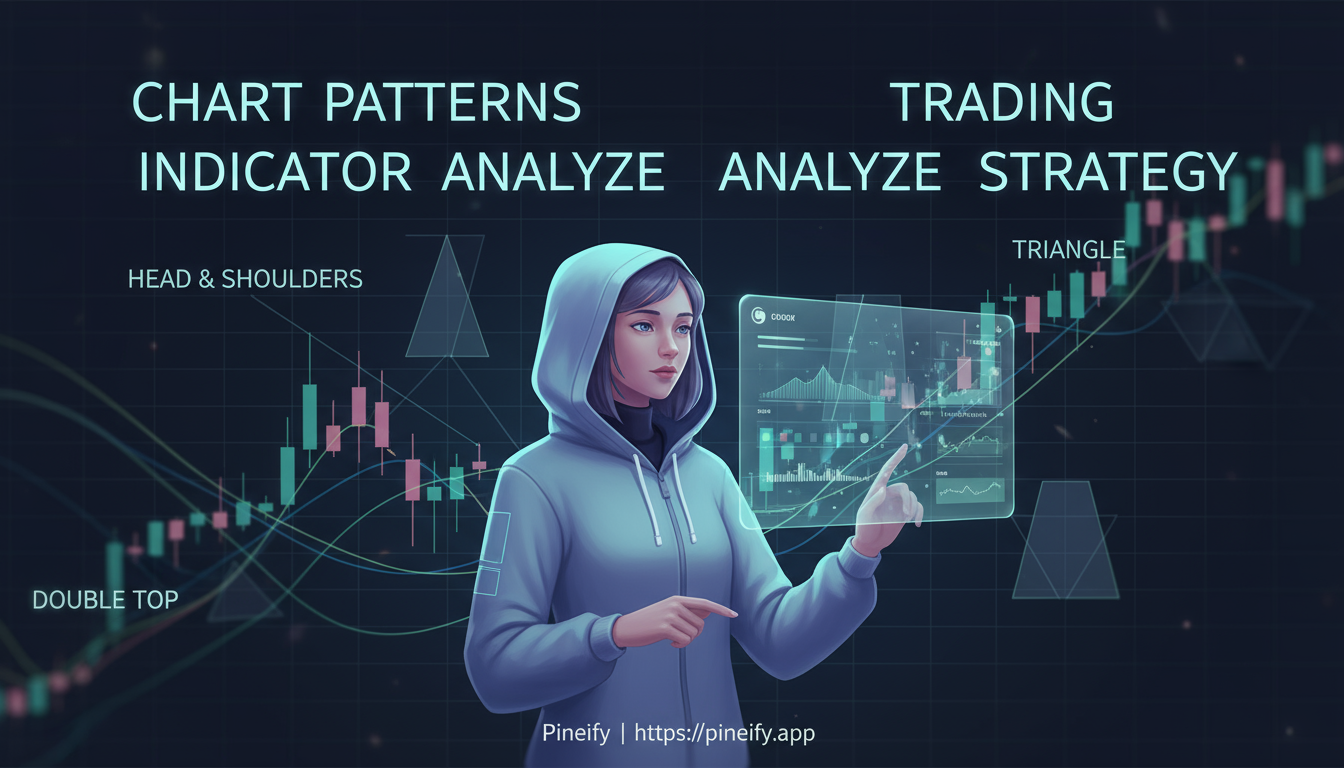
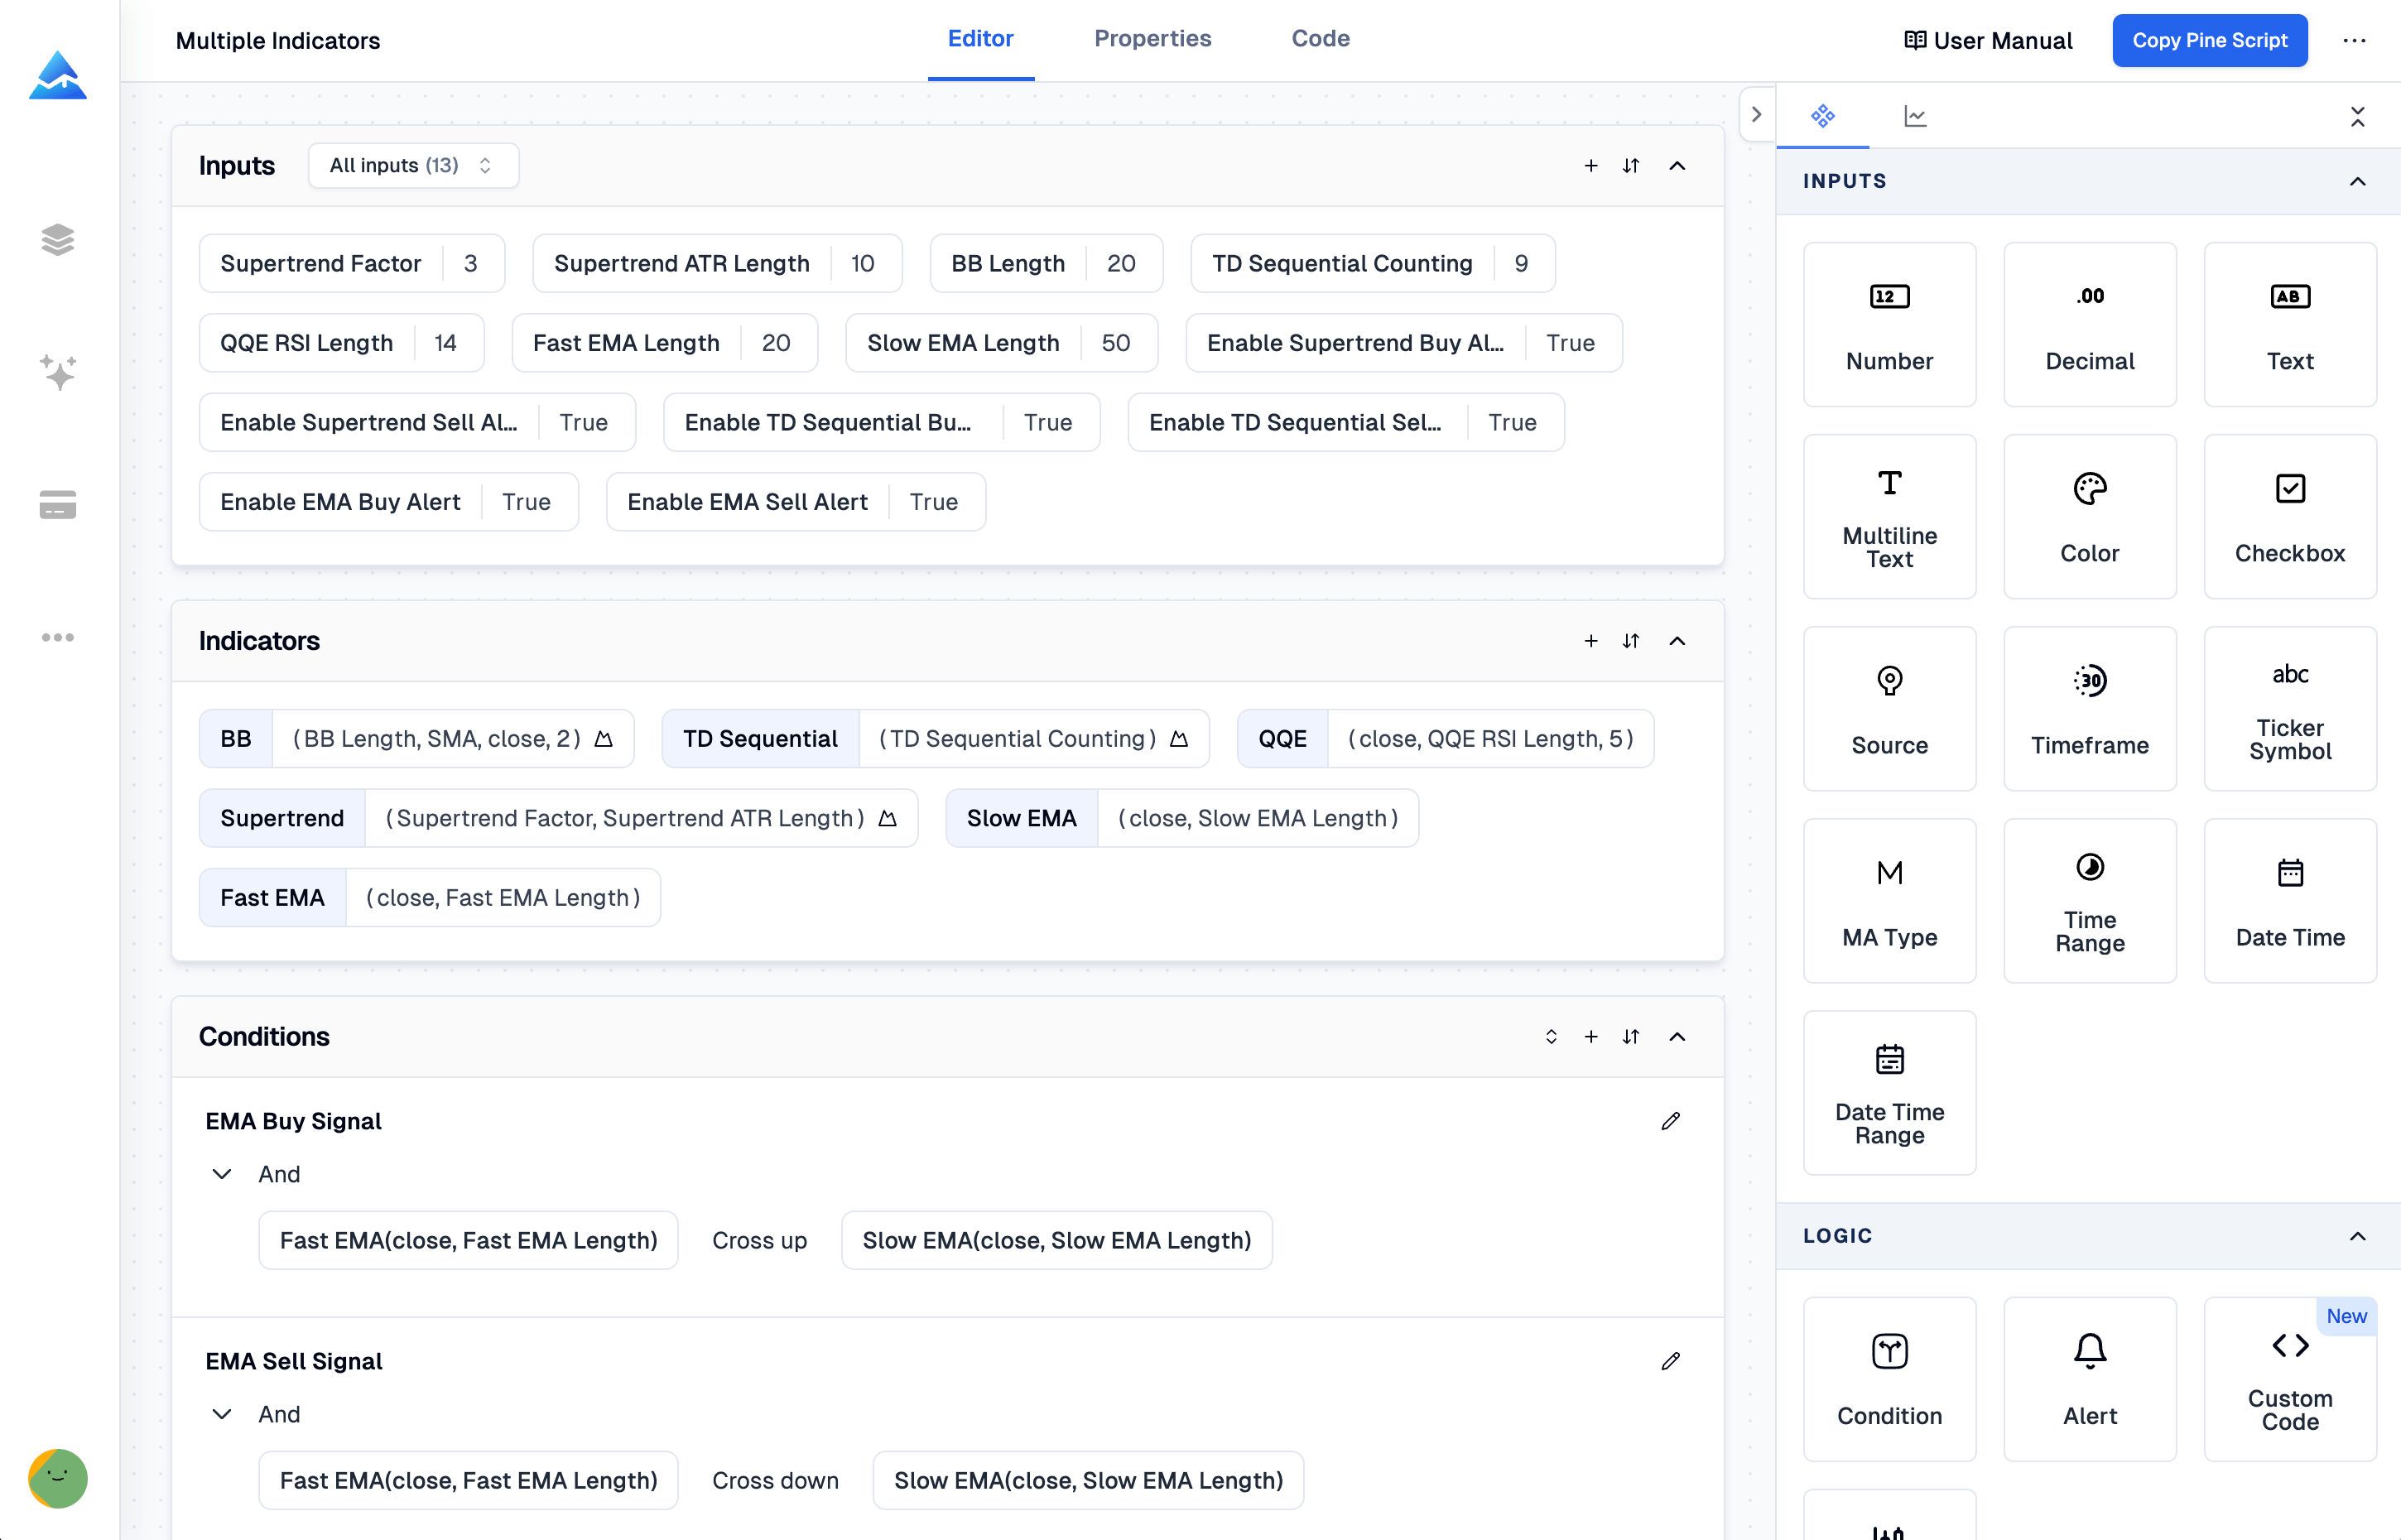
Ever feel stuck staring at your charts, with every indicator telling you something different? You're in good company. Invite-only TradingView indicators are private scripts that require creator permission — their code stays hidden because the strategies behind them have been backtested and the developer wants to protect the logic. In my opinion, the best option for most traders is Pineify® - Signals & Overlays™. I've tested it against LuxAlgo and Leola Lens, and while each has its place, Pineify's signal quality and simplicity win for most situations. Here's the honest breakdown of all three.