Quantstats vs Pineify: Trading Strategy Analysis Compared
· 12 min read
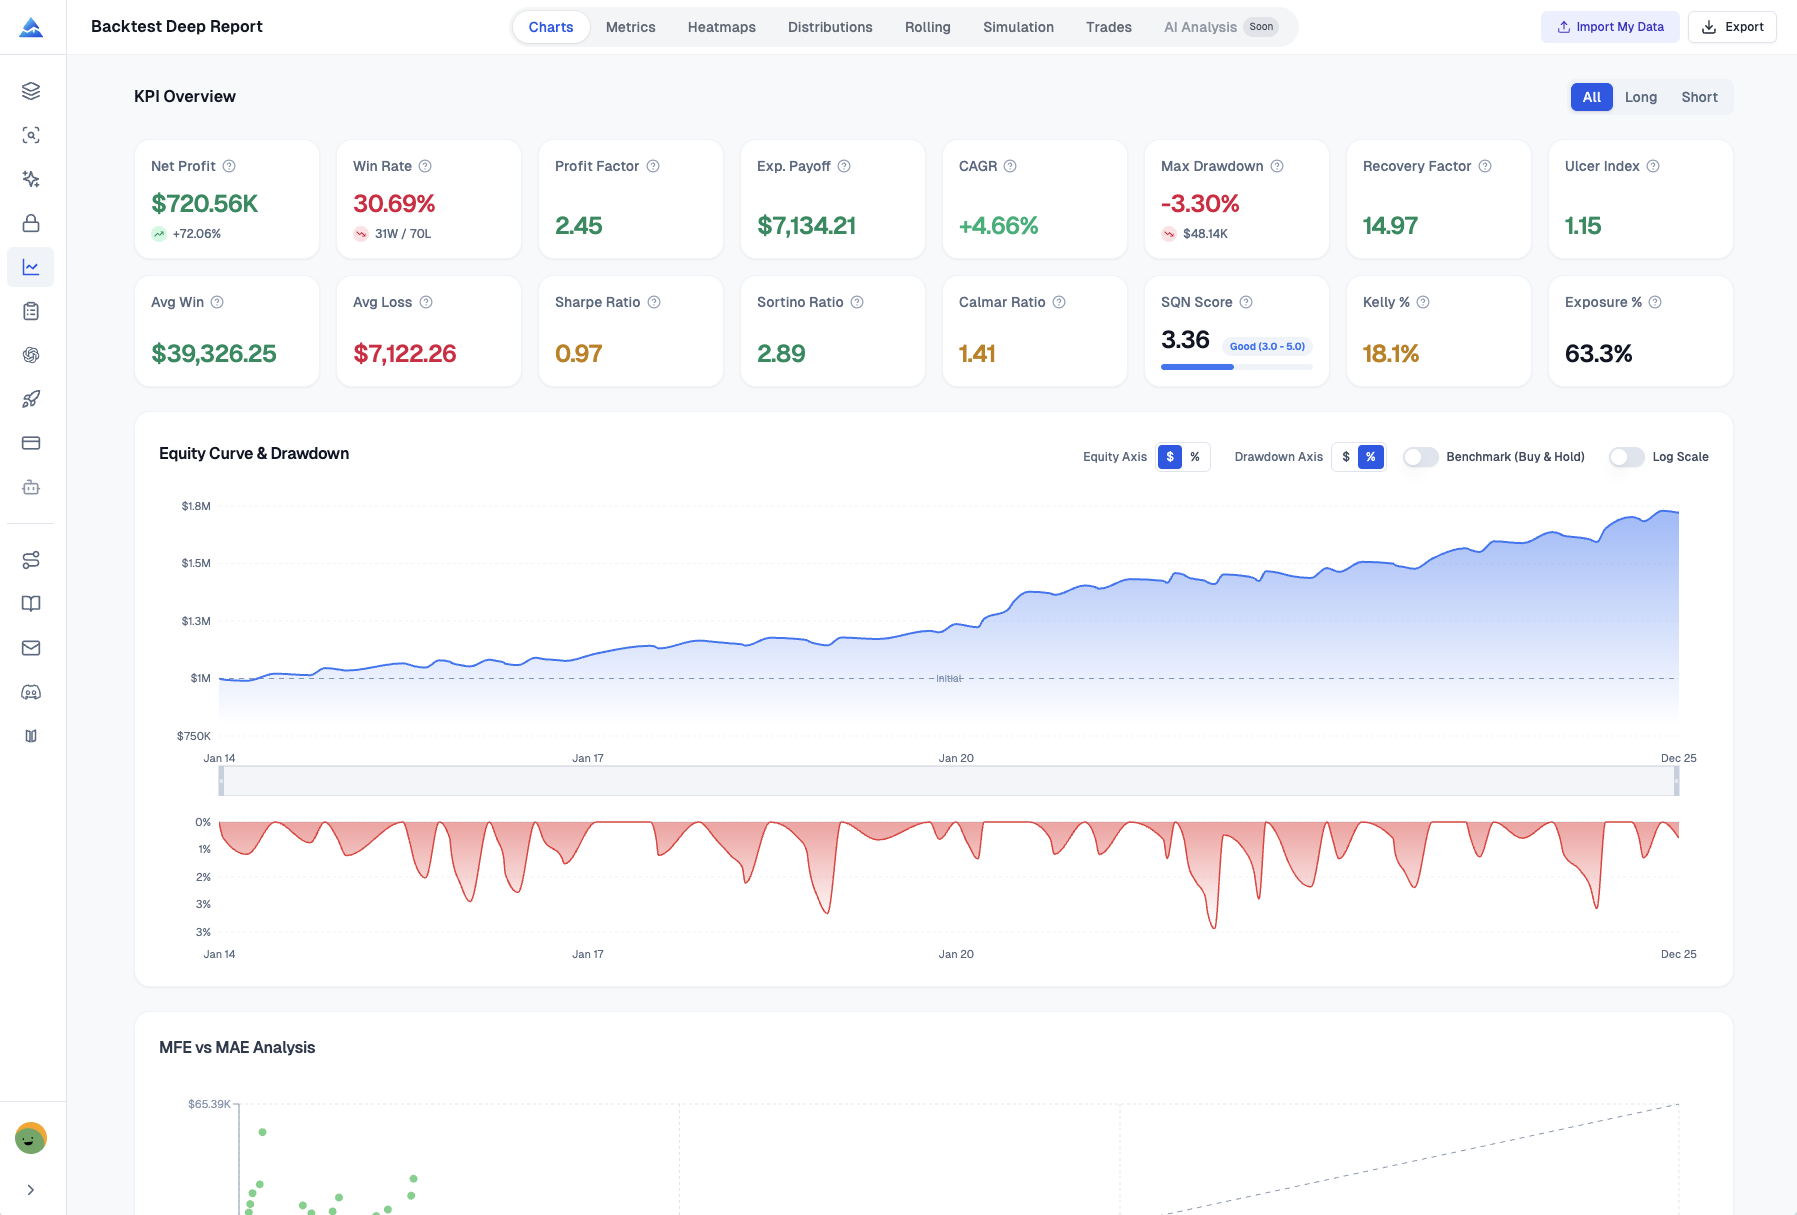
Most backtest reports tell you your final profit and little else. Quantstats and Pineify's Backtest Deep Report both go further, but they serve different traders. Quantstats is a Python library that gives developers 30+ metrics from raw return data. Pineify's Deep Report is a browser-based tool that adds Monte Carlo simulation, MFE/MAE analysis, and Kelly Criterion without any code. I've run both on my own strategies, and here's the verdict: if you want maximum control and write Python, Quantstats is your tool. If you live in TradingView and want deeper analysis in less time, Pineify wins.