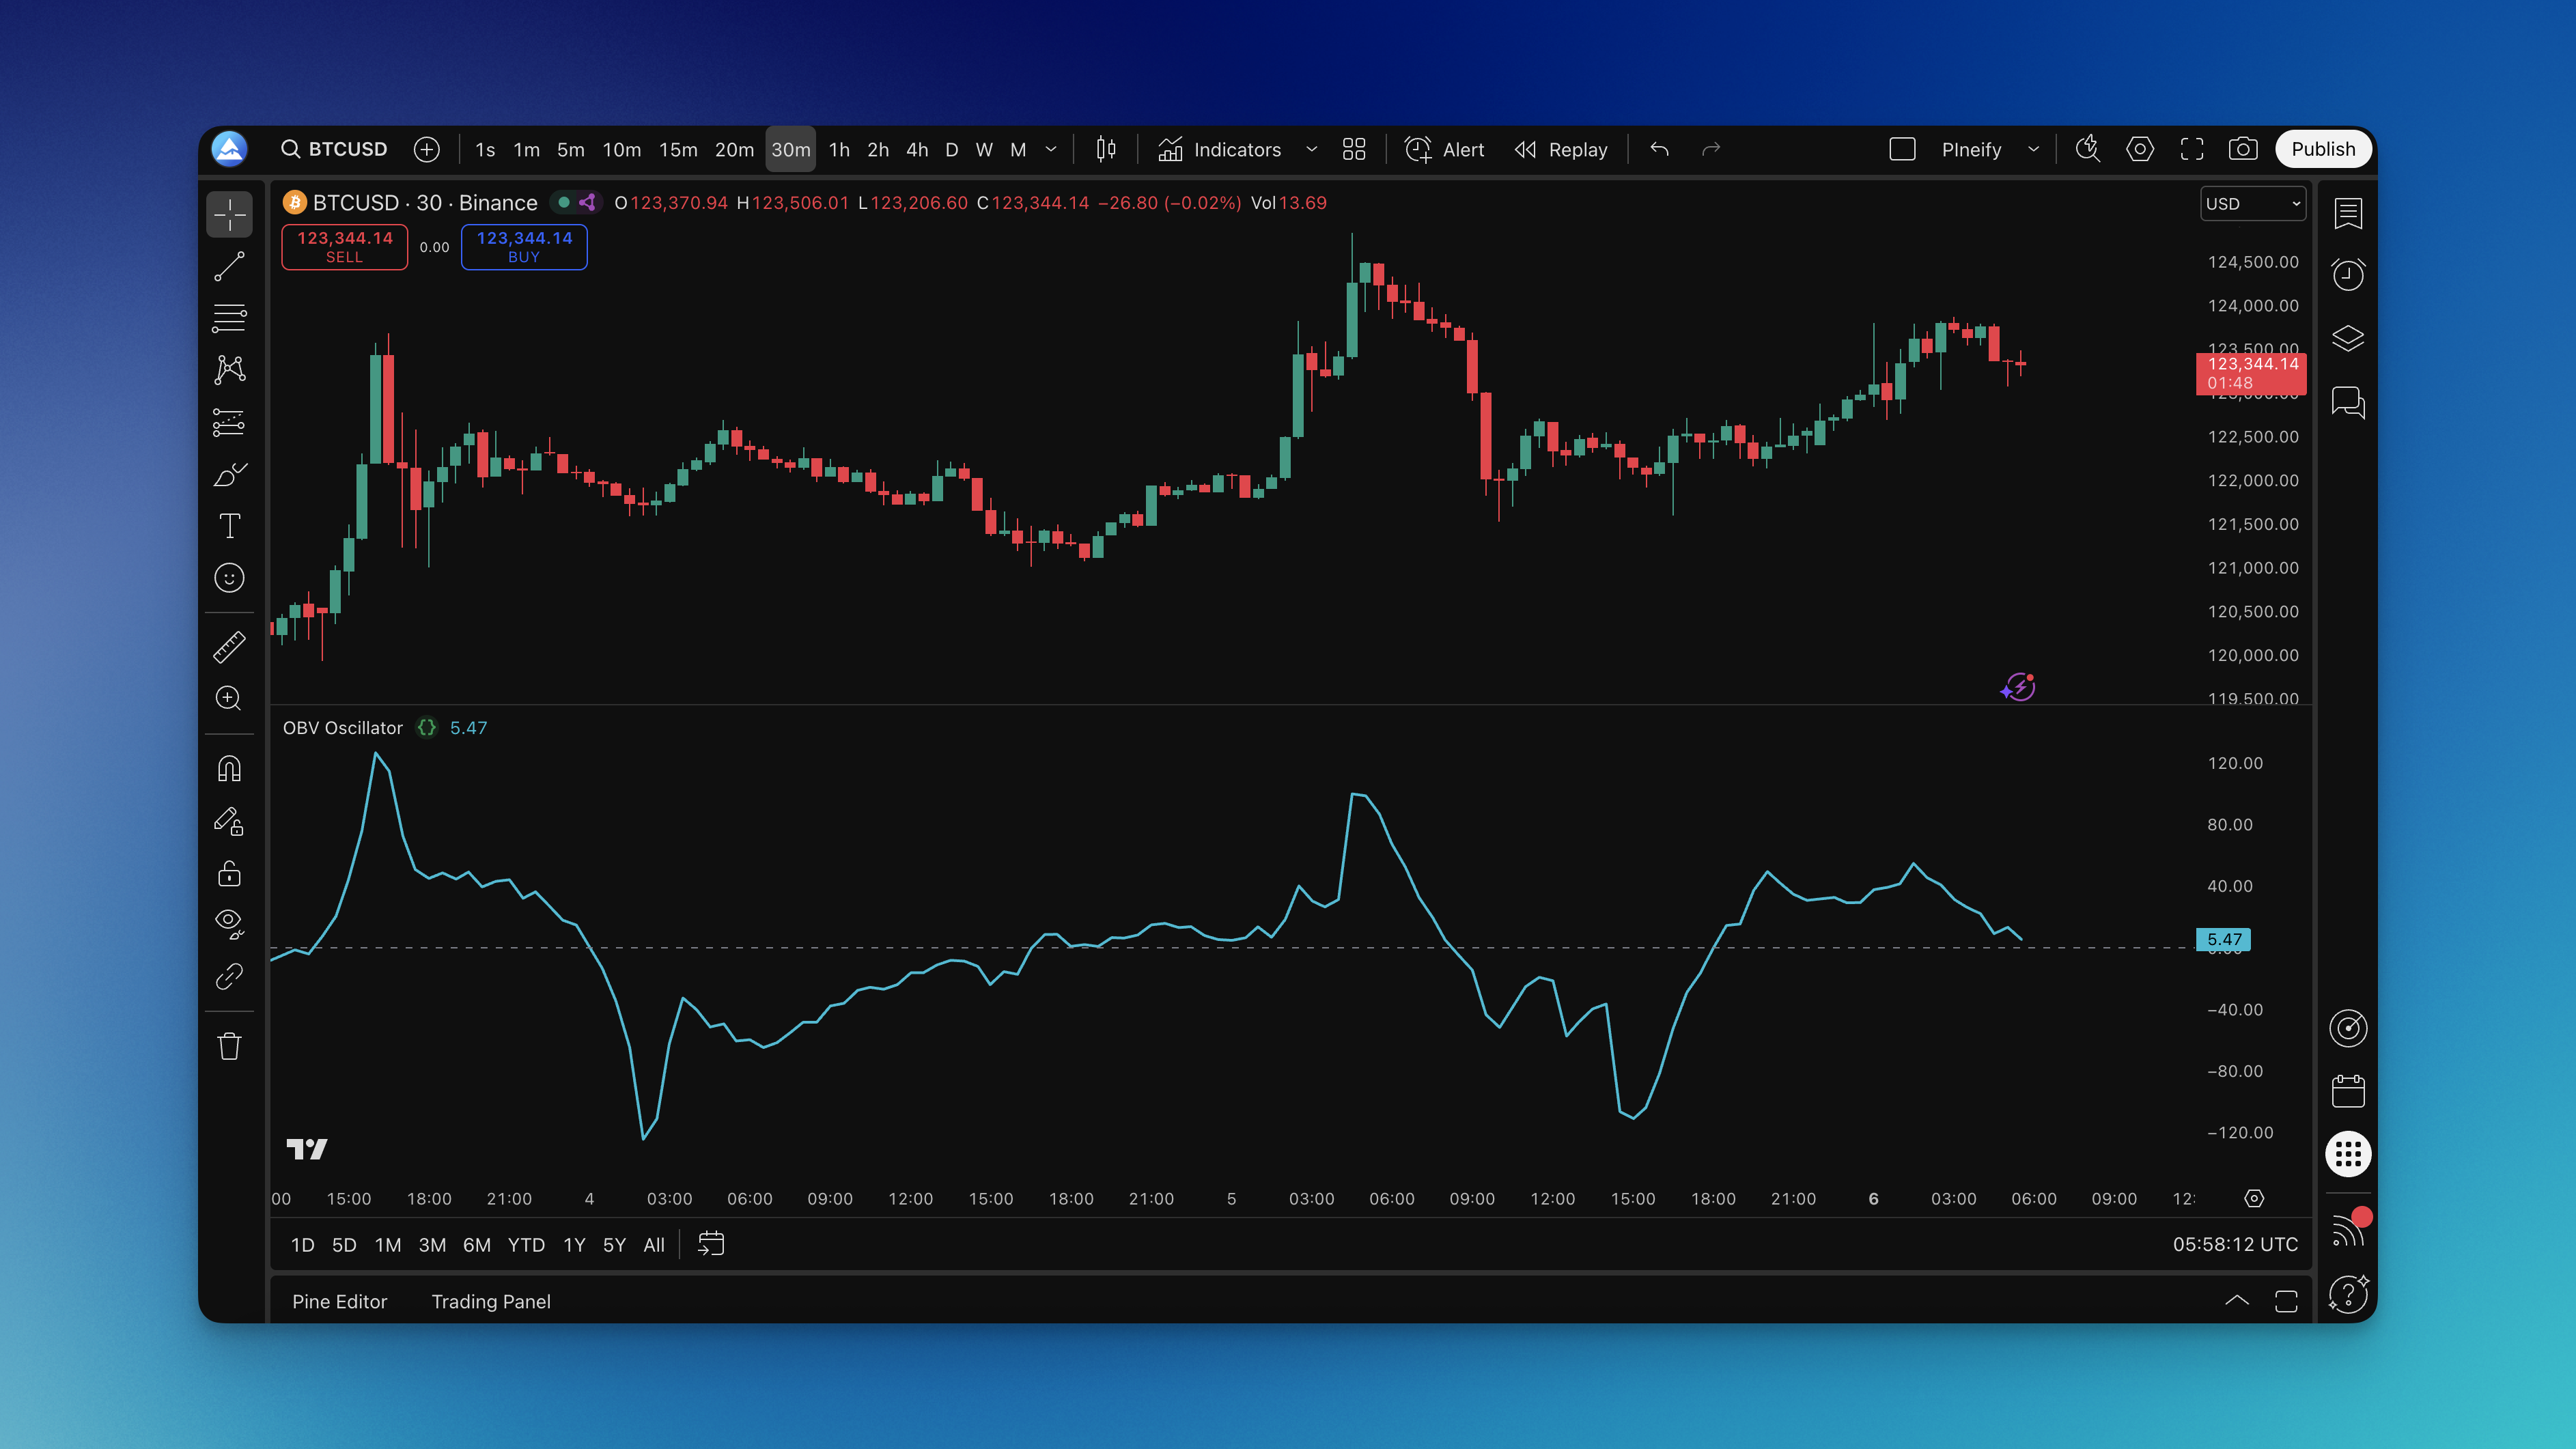
You know that feeling when a stock breaks out on huge volume versus when it barely crawls higher on light trading? The On-Balance Volume (OBV) oscillator is a cumulative volume indicator that tracks buying and selling pressure by adding volume on up days and subtracting it on down days. That difference between real moves and fake ones is exactly what OBV reveals.
Developed by Joseph Granville back in the 1960s, OBV tracks the actual flow of money into and out of a security. While everyone else stares at candlesticks, OBV builds a picture of whether smart money is accumulating or distributing shares. I've been using OBV for about six years now, and it still catches moves that price alone misses.
The concept is simple. When price closes higher than the previous day, OBV adds that day's volume. When price closes lower, it subtracts it. This creates a cumulative line that often telegraphs moves days or weeks ahead.
What makes OBV useful: institutional money behaves differently than retail money. Big players can't slam the buy button - they need time to build positions without moving the market. This patient accumulation shows up in OBV before it shows up in dramatic price moves. I prefer OBV on daily charts for swing trades on names like $AAPL and $SPY, though I haven't tested it in extremely choppy low-volume conditions - those tend to generate noise.
When OBV and price move together, you're seeing genuine trend strength. When they disagree - price makes new highs while OBV doesn't, or vice versa - that's where the real trading opportunities live.