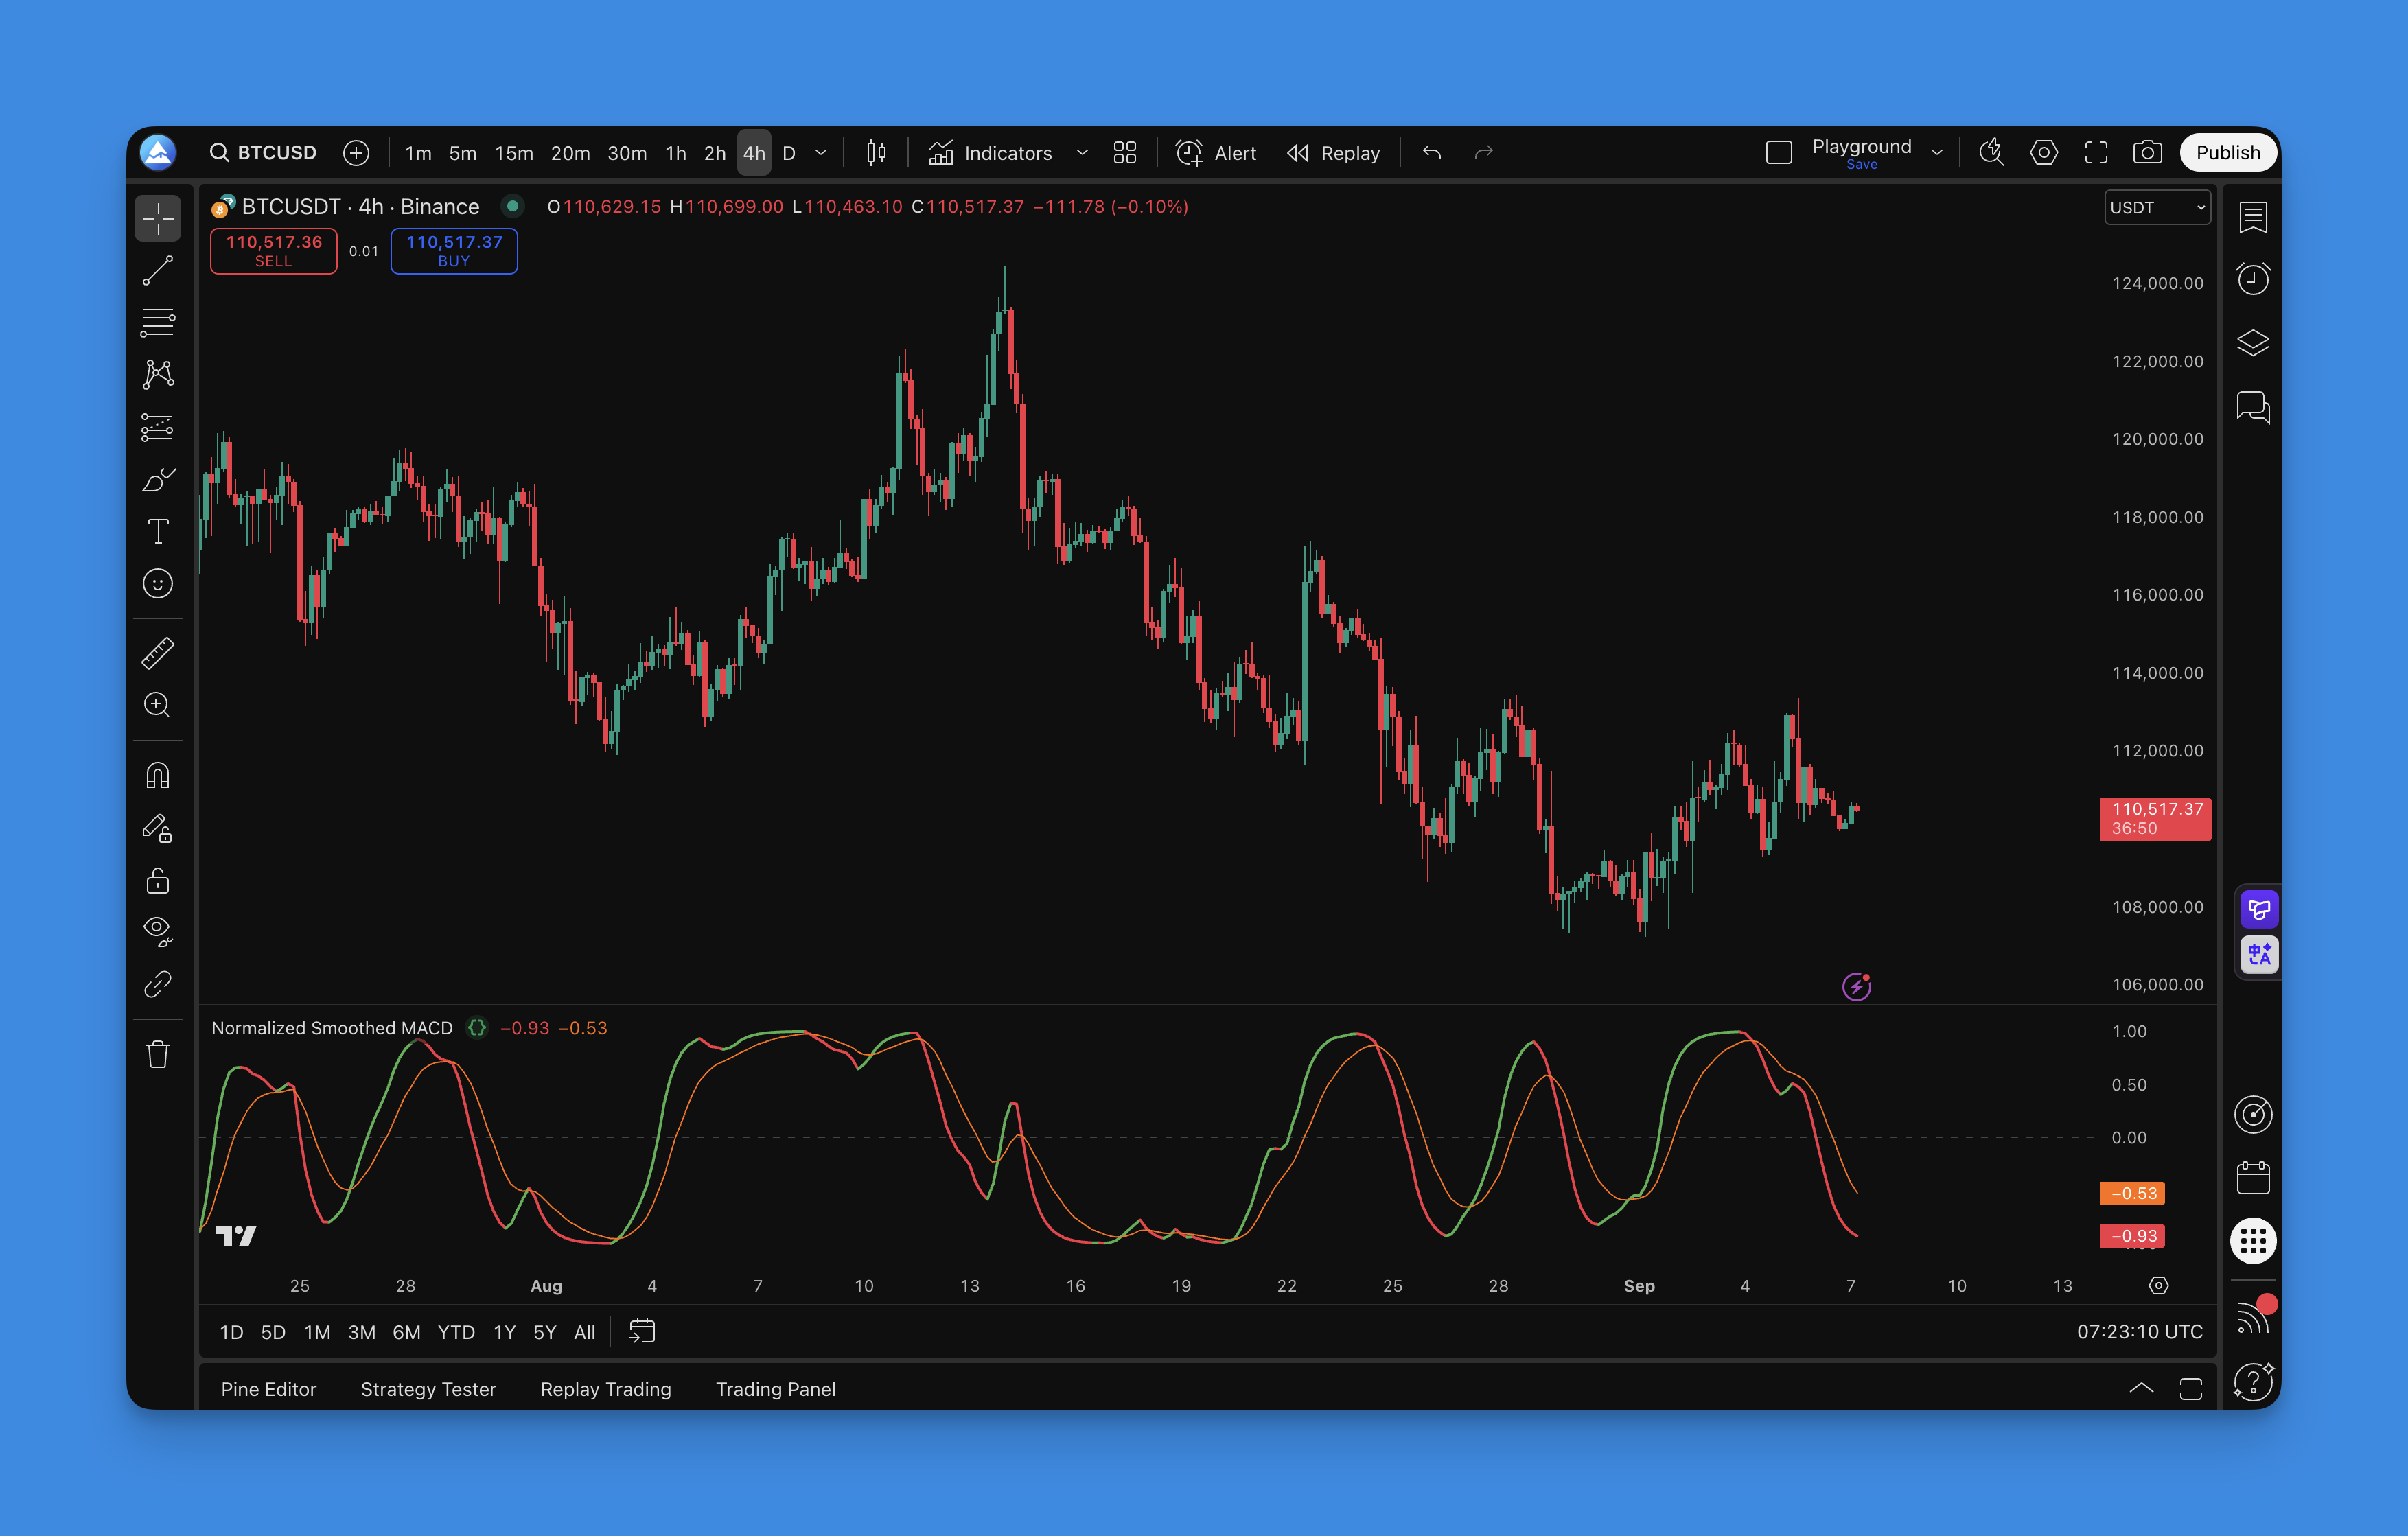
Normalized Smoothed MACD (NSM) Indicator for TradingView
The Normalized Smoothed MACD (NSM) is a MACD variant that normalizes values to a fixed -1 to 1 range and applies extra smoothing. You get the familiar fast/slow line and signal line, but the moves are calmer and the false flips are fewer. I've been running NSM on SPY daily for position bias and on TSLA 15-min for swing entries — the consistent scale means I don't have to re-learn the levels for each ticker.

How to add NSM to TradingView

I use Pineify to set up NSM — it lets me edit, backtest, and push the script to my chart in one place:
- Open the Pineify editor
- Search for "Normalized Smoothed MACD"
- Load it and set inputs (fast/slow/signal, smooth, normalization)
- Click "Copy Pine Script"
- Set colors and levels on TradingView
If you want another way to judge trend strength while setting up NSM, this ADX walkthrough is a good companion: ADX Indicator: Master Trend Strength & Direction in TradingView.

How to use NSM
The NSM indicator gives you several signal types:
Signal line crossovers
Classic MACD read still applies:
- Bullish: NSM line crosses above the signal line
- Bearish: NSM line crosses below the signal line
Zero line context
- Above zero: bullish bias, favor long setups
- Below zero: bearish bias, favor short setups
- Zero crossovers: often mark a momentum regime change
Color cues
- Green rise: building bullish pressure
- Red fall: building bearish pressure
Divergences
Worth watching on swing highs and lows:
- Bullish: price makes a lower low, NSM makes a higher low
- Bearish: price makes a higher high, NSM makes a lower high
I prefer keeping divergences simple: if price and NSM disagree on a swing, I wait for a signal-line cross before entering. Chasing divergences without confirmation led to too many early entries on SPY. For more on this, check the Best RSI Divergence Indicator for TradingView. For a clean trend backdrop, the Moving Average Ribbon Strategy makes direction easier to see.
Best NSM settings by timeframe
The table below shows starting points for each style:
| Parameter | Day Trading (1-5m) | Swing Trading (1-4h) | Position Trading (Daily) |
|---|---|---|---|
| Fast Period | 8 | 12 | 19 |
| Slow Period | 21 | 26 | 39 |
| Signal Period | 5 | 9 | 9 |
| Smooth Period | 3 | 5 | 7 |
| Normalization Period | 14 | 20 | 30 |
Quick guidelines:
- Shorter periods: more signals, more noise
- Longer periods: fewer signals, cleaner trends
- Smooth period: higher = calmer lines, slower turns
- Normalization period: longer = steadier scale
How to backtest NSM
Through the Pineify editor you can turn NSM signals into a backtestable strategy:
Entry and exit ideas
Start simple:
- Long: NSM crosses above the signal line while above zero; exit on an opposite cross or a close back under zero
- Short: NSM crosses below the signal line while below zero; exit on an opposite cross or a close back above zero
Risk basics
Use a stop (last swing low or ATR-based) and aim for at least 1:2 reward-to-risk. Trail behind structure in strong trends.
Backtesting flow
- Define your logic
- Set risk rules
- Pick a test window
- Run and review the results
- Adjust only what clearly helps — I've found that tweaking too many parameters at once makes it impossible to know what actually improved performance.
If you want working patterns to study, these examples help: Pine Script v6 Strategy Examples.
FAQs
What makes NSM different from regular MACD?
Two upgrades: values are normalized to a fixed scale and smoothed to cut noise. You still read it the same way as MACD.
What timeframes work best?
It scales well. I usually run 1-hour to daily for swing trades, shorten smoothing for scalps, and lengthen it for position trades.
How do I reduce false signals?
Increase smoothing, lengthen the normalization period, and add a trend filter like ADX or a moving average. I run ADX alongside NSM on SPY and it cuts out most of the fake crossovers.
Does it work on crypto?
Yes. The normalization helps when volatility swings hard. I've used it on BTC and ETH with the swing settings and it tracks momentum cleanly.
What pairs well with NSM?
Trend filters (moving averages, ADX) and a momentum-and-volatility lens like Bollinger with RSI. I haven't tested NSM with the SuperTrend yet but the idea is similar.
How often should I tweak settings?
Not often. I review settings monthly or when market behavior clearly shifts. Over-optimizing on recent data is a trap I've fallen into before.
Nothing here is financial advice. Test first, start small, and adjust thoughtfully.