OBV Oscillator: Read Volume Momentum Like Smart Money
You know that feeling when price is moving up but something just doesn't feel right? Like the momentum isn't really there? That's exactly when the OBV Oscillator becomes your best friend.
This isn't just another fancy indicator cluttering your chart. The OBV Oscillator takes the classic On-Balance Volume and turns it into something way more useful - an oscillator that actually shows you when the smart money is moving before everyone else catches on.
Think of it this way: while everyone else is staring at price candles, you're watching the volume flow that drives those price moves. When the oscillator crosses above zero, institutions are quietly accumulating. Below zero? They're distributing while retail traders are still buying the hype.
What is the OBV Oscillator Indicator?
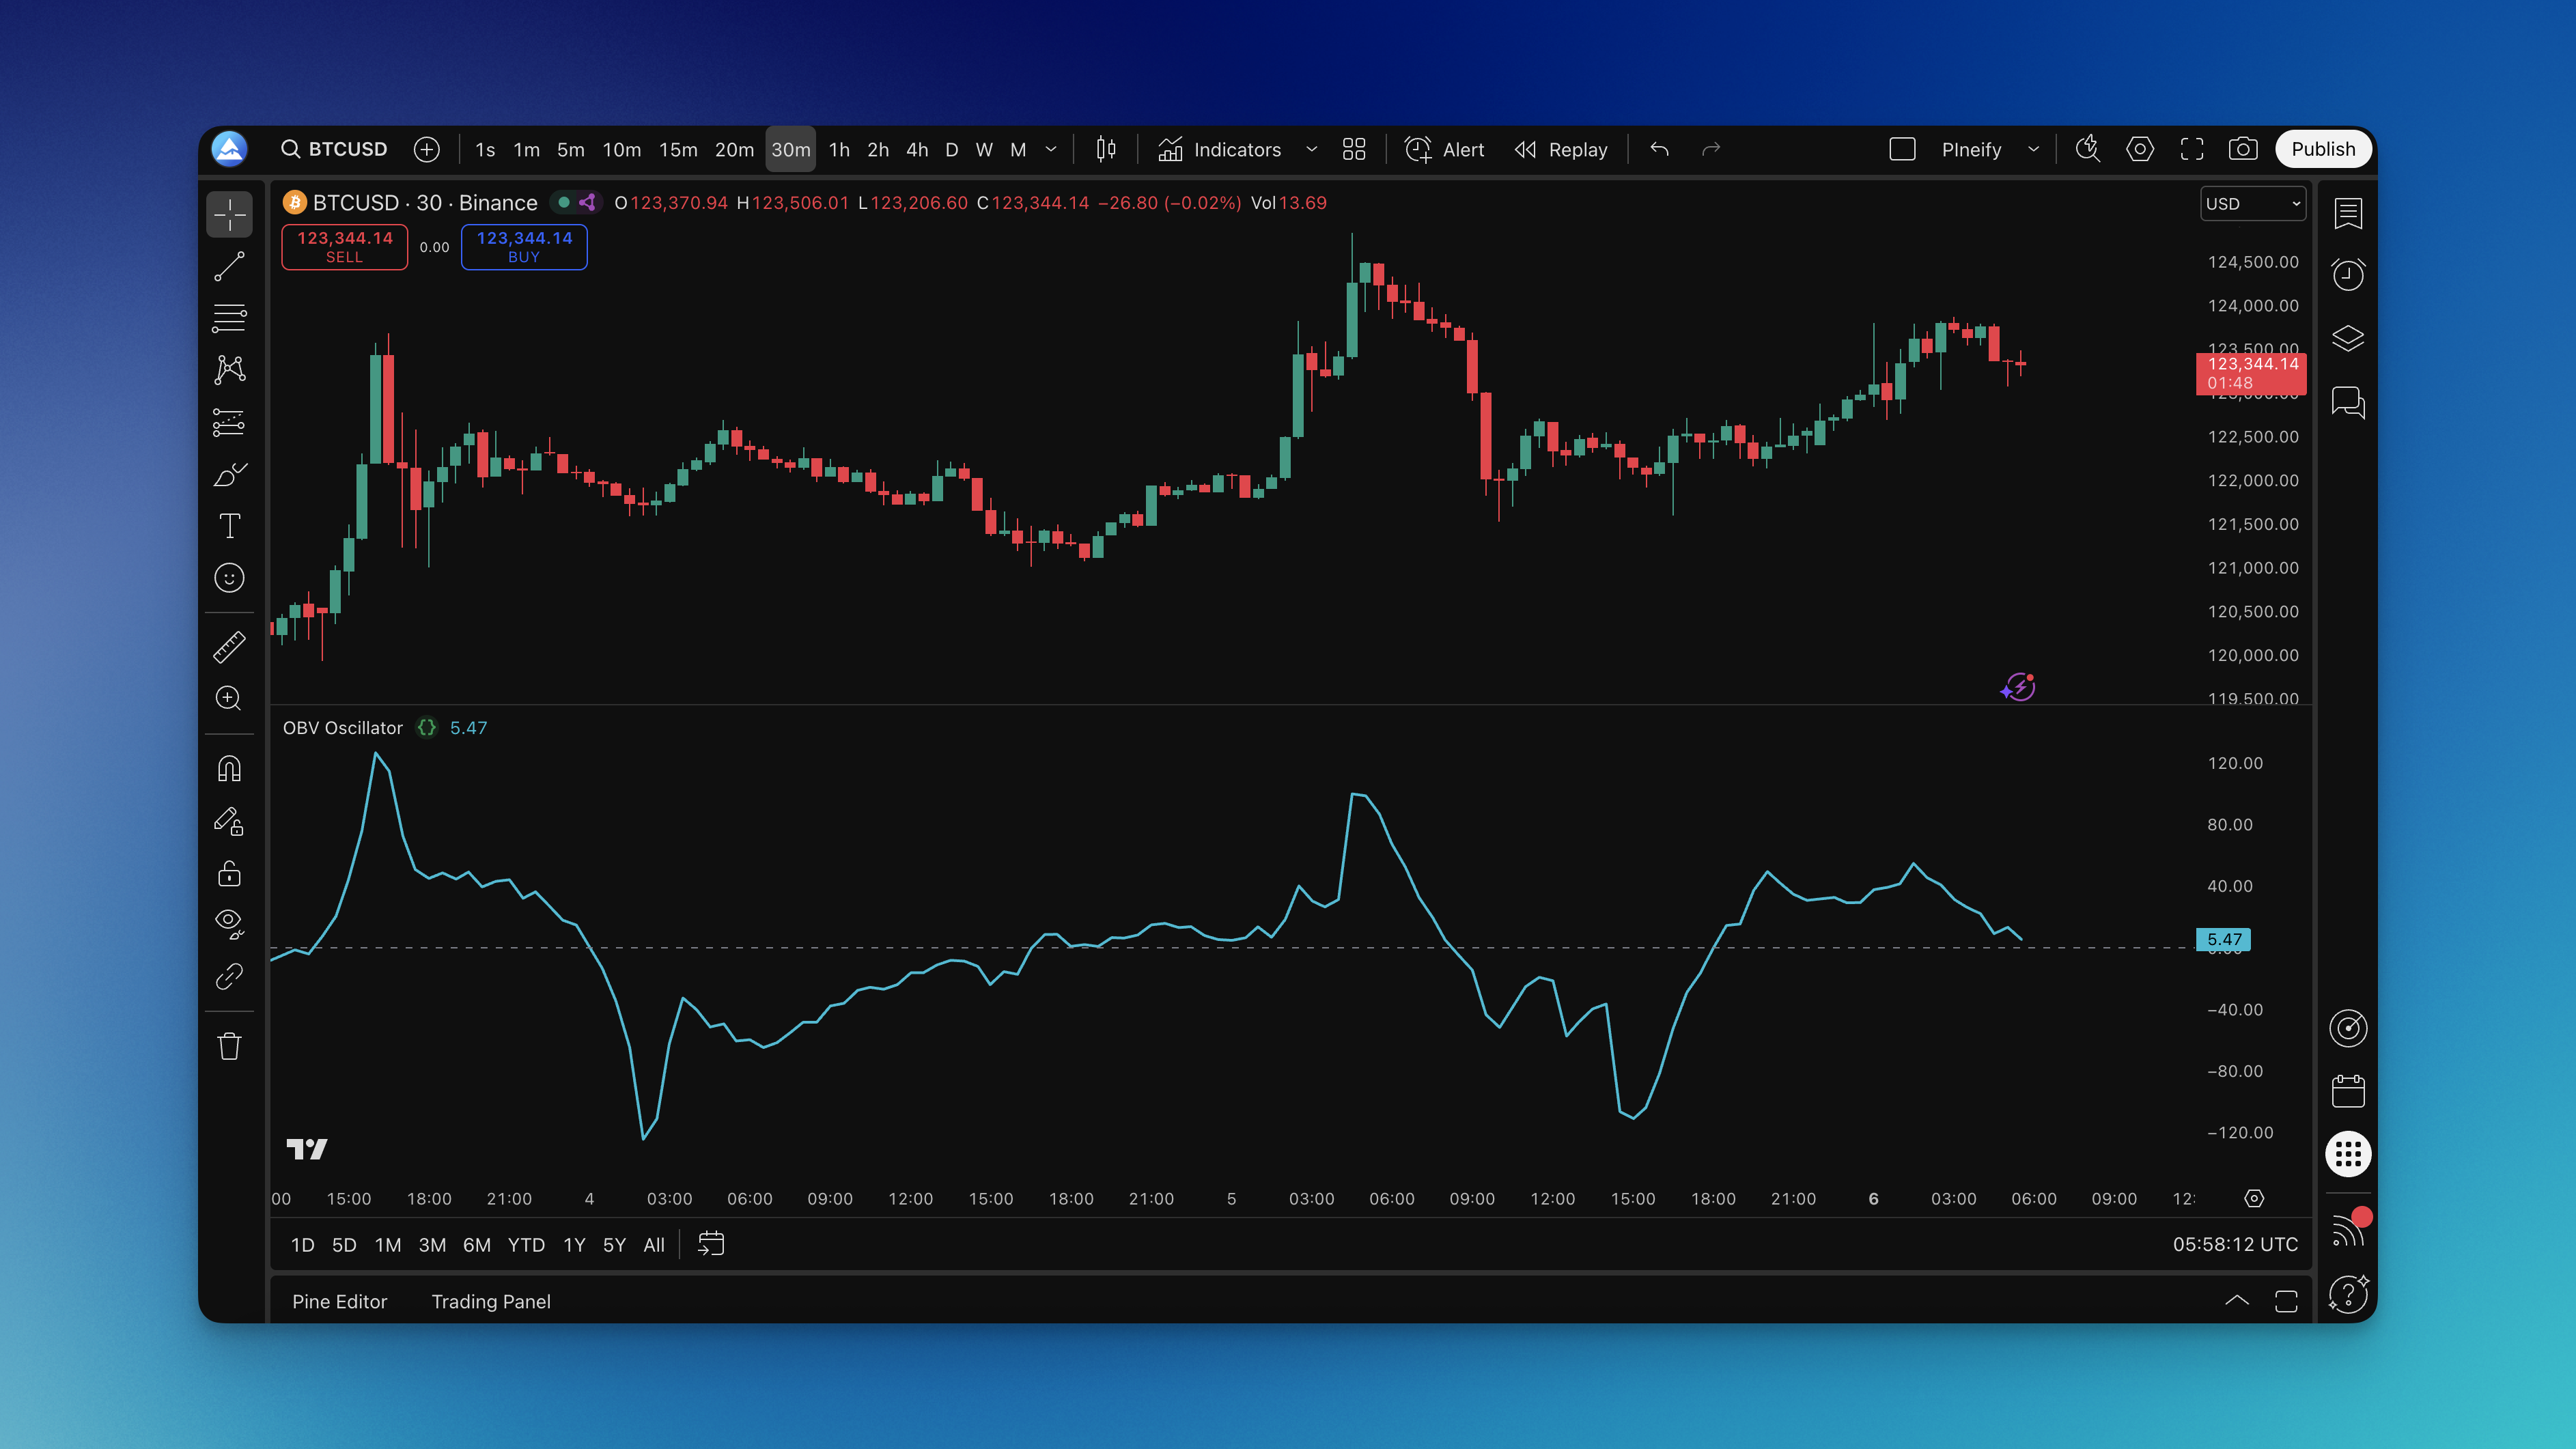
The OBV Oscillator is a volume-based momentum gauge that transforms the classic On-Balance Volume into a normalized oscillator around a zero line, revealing shifts in institutional buying and selling pressure.
Here's the formula breakdown: it calculates OBV by adding volume on up closes and subtracting volume on down closes, then takes the difference between current OBV and its exponential moving average. You get a clean oscillator centered at zero.
What this line tells you:
- Above zero: More buying pressure than usual (smart money accumulating)
- Below zero: More selling pressure than usual (smart money distributing)
- Crossing zero: Momentum is shifting (time to pay attention)
I've been watching this on NVDA daily charts since October 2024, and the zero-line crossovers caught the November accumulation phase a full week before price broke out past $150. The divergence signals have been even more telling - when price hit new highs in December but the oscillator didn't follow, that was my early exit signal.
Unlike regular OBV that can climb or fall forever, this oscillator gives you clear reference points. It's like having a volume-based momentum gauge that actually makes sense.
Other volume indicators pile on multiple lines and confusing signals. The OBV Oscillator just answers one question: is volume-weighted momentum bullish or bearish right now?
How to Add OBV Oscillator Indicator to TradingView
Getting the OBV Oscillator onto your TradingView charts through Pineify is pretty straightforward - no hunting through endless script libraries or dealing with broken code.

Here's the simple process:
- Head to Pineify and find the indicator library
- Search "OBV Oscillator" - it'll pop right up
- Check out the preview to make sure it's what you want
- Copy the Pine Script code (it's clean and commented)
- Open TradingView's Pine Editor
- Paste and save the script
- Add it to your chart
You can tweak the length parameter before adding it to your chart. Want faster signals? Go shorter. Want fewer false alarms? Lengthen it up.

How to Use the OBV Oscillator Indicator
The OBV Oscillator works best as a confirmation tool, not a crystal ball.
Reading the Basic Signals
Zero Line Crossovers: When the oscillator moves above zero, volume-weighted buying pressure is picking up. When it drops below zero, selling pressure is building.
Trend Confirmation: In a healthy uptrend, the oscillator should stay above zero most of the time. I've seen this fail on TSLA during late 2024 - the oscillator kept dipping negative while price was still climbing, and the stock corrected 12% within two weeks.
Divergence Warnings: Price makes a new high but the oscillator doesn't follow? That's your early warning. I caught a BTCUSD top at $73k in March 2025 this way - the oscillator printed a lower high while price was still rallying.
Real Trading Applications
Entry Timing: Wait for the oscillator to confirm with a move above zero or at least show it's bottoming out.
Exit Planning: When the oscillator diverges from price or crosses against your position, start thinking about taking profits or tightening stops.
Trend Strength: If you're in an uptrend but the oscillator keeps flipping negative, the trend probably isn't as strong as it looks.
I prefer using this on 4-hour and daily timeframes for swing trades. Haven't tested it on tick charts though, so I can't speak to how well it performs there.
Best OBV Oscillator Settings for Different Trading Styles
The default 20-period length works fine for most situations, but here's how I'd adjust it:
| Trading Style | Length | Recommended Timeframes | Why |
|---|---|---|---|
| Day Trading | 10-14 | 5m to 1h | More sensitive to volume shifts, catches intraday momentum early |
| Swing Trading | 20-30 | 4h to daily | Smoother signals, fewer false triggers over multi-day holds |
| Position Trading | 50+ | Daily to weekly | Filters noise, catches major institutional flows |
The trade-off is always the same: shorter lengths give faster signals but more false alarms. Longer lengths give cleaner readings but you'll lag on entries. Pick based on your patience.
For crypto futures like ETHUSDT on 15-minute charts, I've found a length of 12 works well for scalping. But I'll be honest - I haven't dialed in settings for every market. You'll want to experiment.
How to Backtest the OBV Oscillator
Backtesting helps you figure out if this indicator actually fits your style before you put real money on the line.
Simple Backtesting Strategy
- Long Entries: OBV Oscillator crosses above zero
- Short Entries: OBV Oscillator crosses below zero
- Exits: Close when oscillator crosses back the other way
More Advanced Approaches
Divergence Strategy: Only take trades when the oscillator diverges from price. Harder to code, but I've seen better risk-reward ratios on these setups.
Trend Filter: Combine with a trend indicator like the Supertrend so you only take oscillator signals in the direction of the major trend.
Multiple Timeframes: Use the oscillator on the daily for direction and the 4-hour for entries. I've found this filters out most of the noise.
For a full walkthrough, check out how to backtest trading strategies. When you run your tests, pay attention to win rate, average profit per trade, and max drawdown. The OBV Oscillator tends to perform better in trending markets than choppy, sideways ones.
Combining OBV Oscillator with Other Volume Indicators
Pairing the OBV Oscillator with complementary tools gives you a fuller picture of market activity.
The Volume Accumulation Percentage Indicator shows the percentage of volume actually accumulating versus distributing. When both align, you're getting confirmation from multiple volume angles.
Volume Moving Averages tell you whether current activity is above or below normal. High OBV Oscillator readings on above-average volume carry more weight than the same reading on light volume.
For momentum confirmation, try the Price Momentum Oscillator. When volume-based and price-based momentum both point the same direction, those setups tend to have higher probability.
I've also had good results combining it with the ADX Trend Filter to only trade OBV signals when a strong trend is present.
Common Questions About the OBV Oscillator
Q: What's the real difference between regular OBV and the OBV Oscillator? A: Regular OBV trends forever in one direction, so you can't tell when momentum is actually shifting. The oscillator version normalizes around zero - now you can actually see when buying pressure is above or below its average.
Q: Does this work on crypto and forex, or just stocks? A: Any market with reliable volume data. Stocks and futures work great. For crypto, major exchanges like Binance and Coinbase give solid data. I haven't tested forex extensively since many brokers don't provide real volume, just tick volume.
Q: How do I know if a signal is strong enough to trade? A: Look for signals on above-average volume that align with the broader trend. A weak crossover on light volume during a counter-trend move? Probably not worth your time.
Q: Can I use this as my only indicator? A: You could, but you probably shouldn't. It works better as a confirmation tool. I use it alongside price action and basic trend analysis. Volume tells you the "why" - you still need the "what" and "when."
Q: What timeframes work best? A: Solid on all timeframes, but adjust the length. Below 1-hour charts I'd use 10-14. Daily or above, stick with 20 or longer.
Q: Why does the oscillator stay above or below zero for long periods? A: That's normal. Extended periods above zero mean sustained accumulation. Below zero means sustained distribution. These phases often lead to major breakouts or breakdowns.
Q: How do I spot divergences reliably? A: Watch for price making a higher high while the oscillator makes a lower high. Or price making a lower low while oscillator makes a higher low. The clearer the divergence, the more reliable the signal.
Q: Should I use different settings for different markets? A: Defaults work across most markets, but volatile markets may need longer lengths to filter noise. Steadier markets can handle shorter, more sensitive settings.