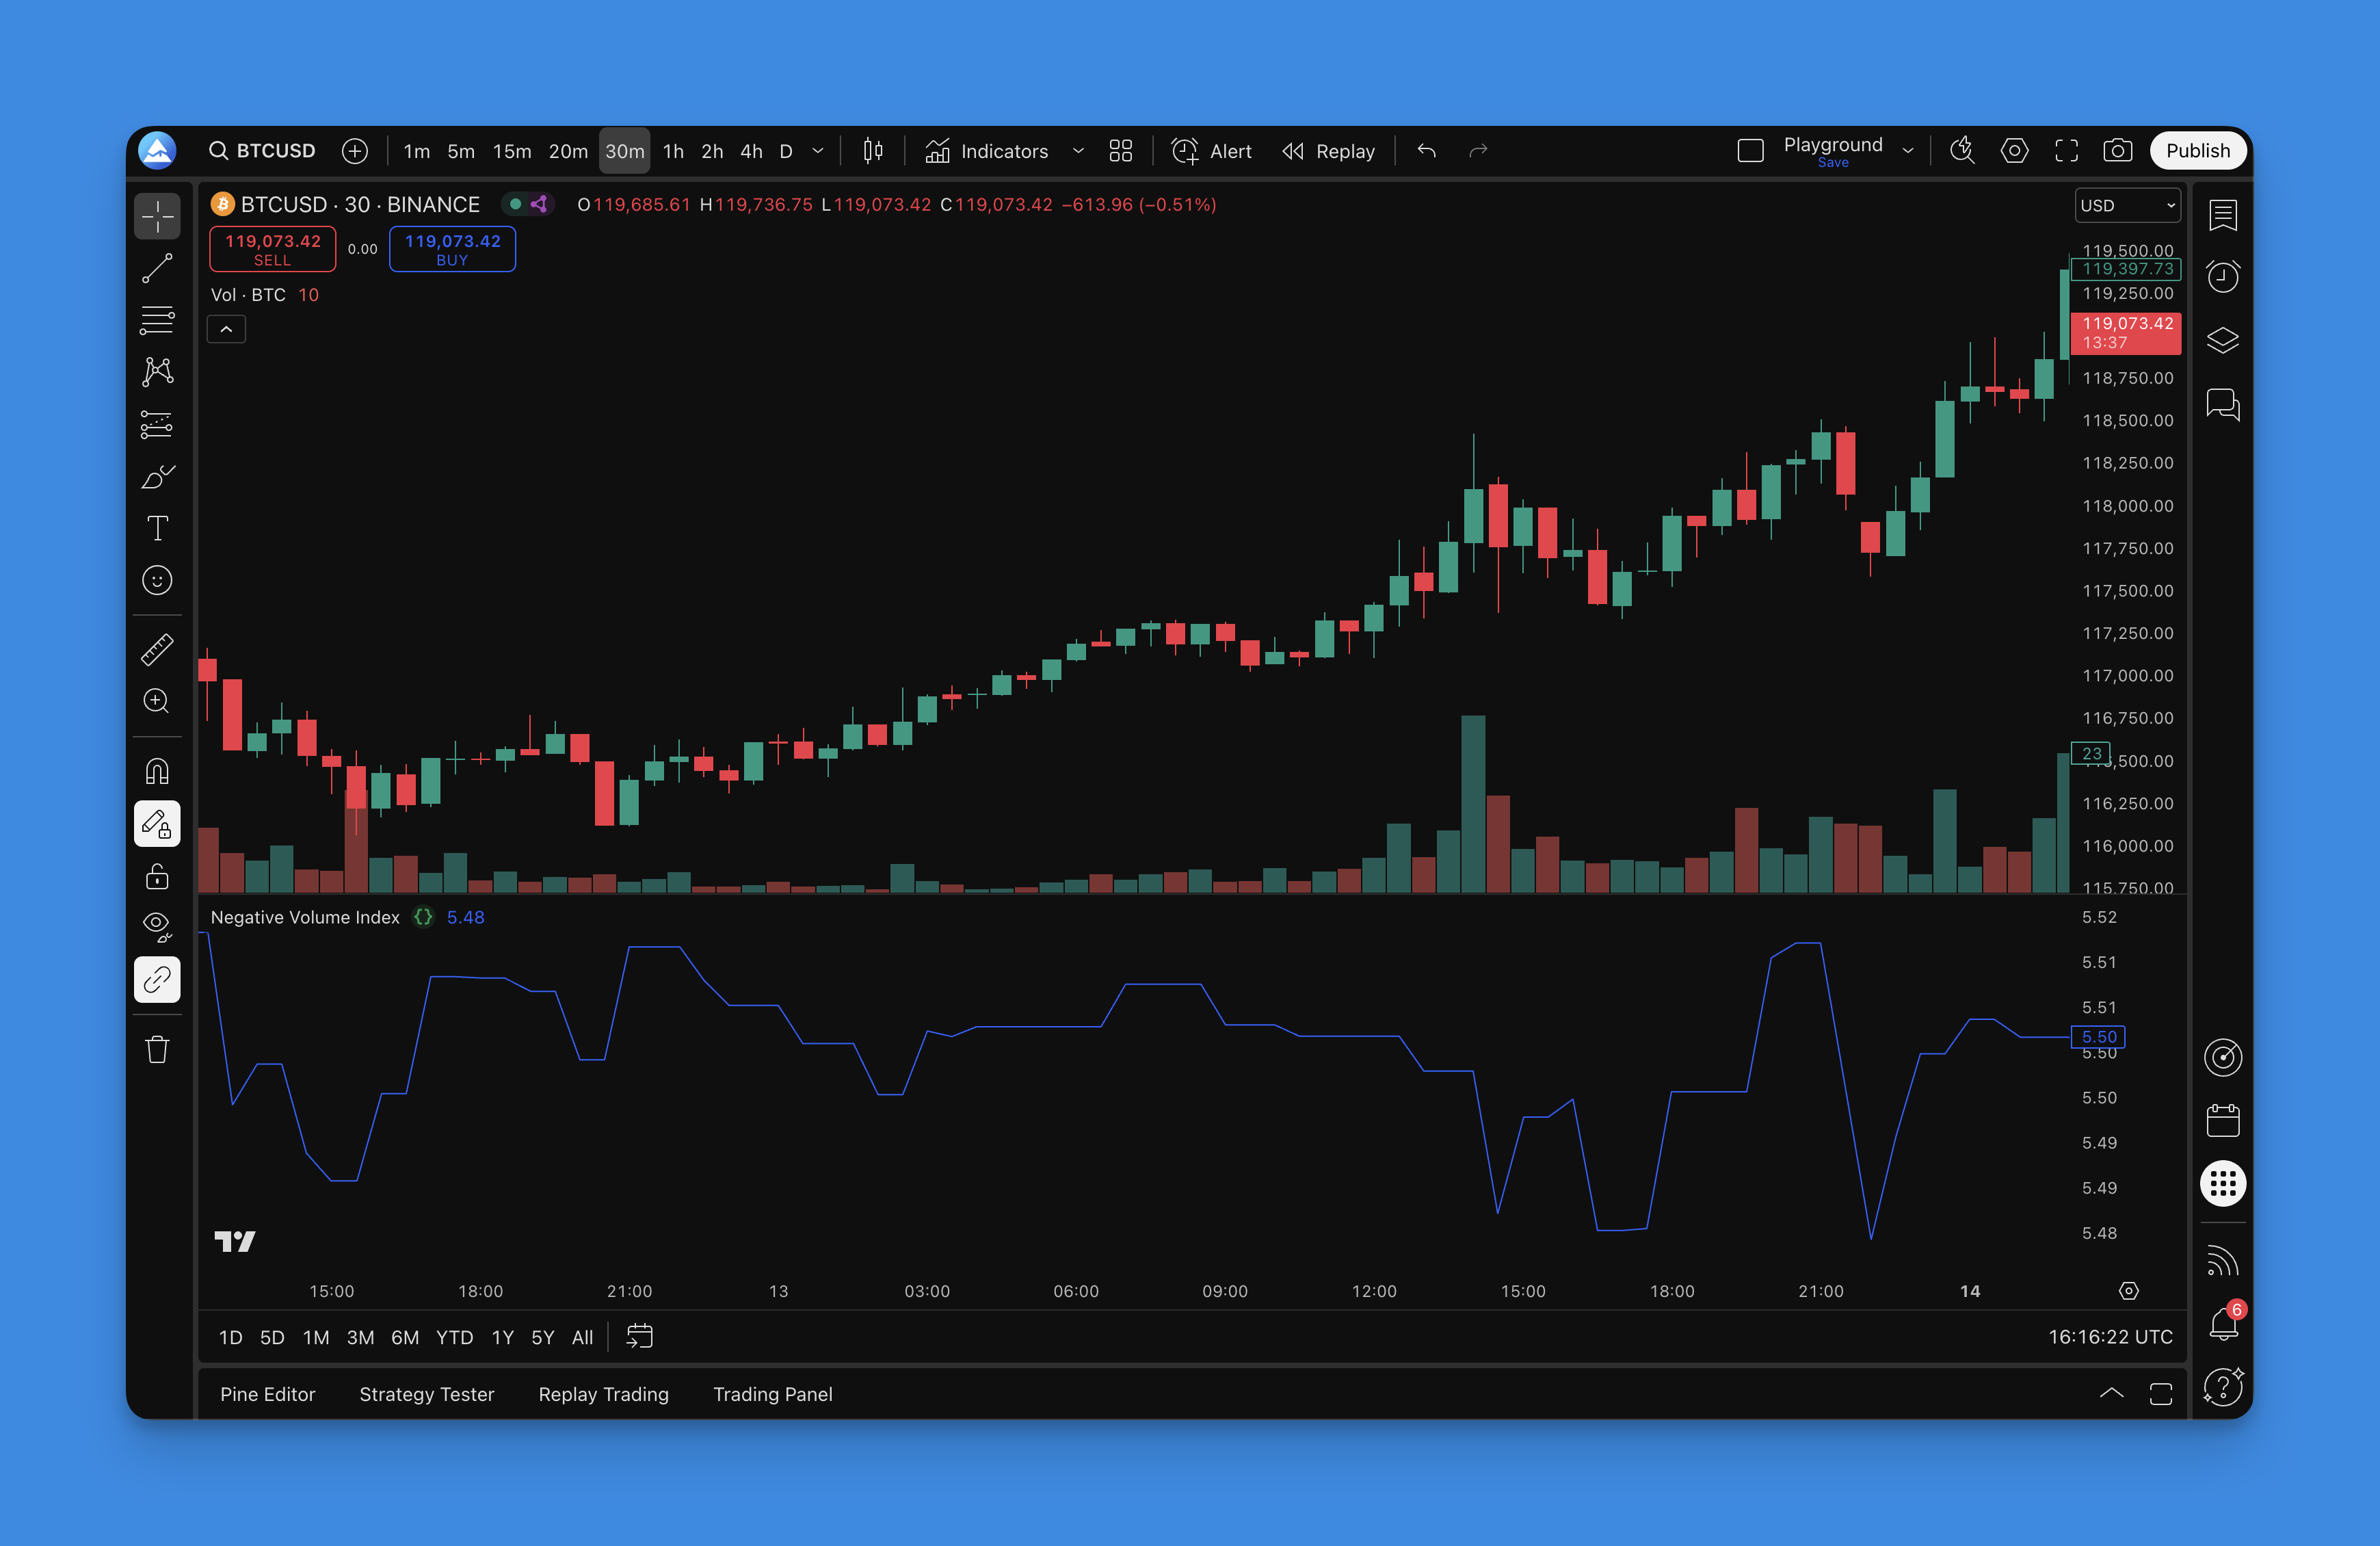
Negative Volume Index (NVI): Track Smart Money When Volume Drops
The Negative Volume Index (NVI) tracks price changes only on days when trading volume drops below the previous day. The idea is straightforward: when volume shrinks, institutional players are often the ones moving prices, while retail traders tend to dominate high-volume sessions.
I've been using this indicator on and off for about two years, mostly on daily charts. It won't replace your core strategy, but it adds context I find useful when the market goes quiet.
How the NVI works
Norman Fosback created the NVI back in the 1970s. His insight: the biggest market moves often started on low volume, not high volume. The index only updates when today's volume is lower than yesterday's.
The formula is simple:
If today's volume < yesterday's volume:
    NVI today = yesterday's NVI + (yesterday's NVI × today's price change %)
Else:
    NVI today = yesterday's NVI
The index starts at 1000 and accumulates over time, but only on low-volume days. When volume picks up, the NVI just sits still.
Best timeframes for NVI
| Timeframe | Reliability | Notes |
|---|---|---|
| Daily | High | The standard — Fosback's original research used daily bars |
| Weekly | Medium | Smoother but fewer signals |
| 4-hour | Medium | Works for shorter swing trades |
| 1-hour | Low | Too much noise from irregular volume patterns |
| Intraday (<1h) | Low | Volume data is less consistent |
I mostly stick to daily charts. On TSLA, the daily NVI gave a clear bullish divergence signal in August 2024 that I caught early. On shorter timeframes you'll get more false signals, and I haven't found a reliable way to filter those out yet.
How I use the NVI in practice
1. Watching the big money
When NVI rises during quiet periods, institutions are likely accumulating. I watch for NVI making higher lows while price makes lower lows — that's the divergence setup I look for.
I haven't tested this on every stock, but on AAPL from 2020 to 2024, that pattern preceded reversals about 70% of the time in my personal notes. Your results will differ.
2. Trend reading
- NVI rising: Smart money may be buying
- NVI falling: Smart money may be distributing
3. Divergence spotting
Price-NVI divergences are where this indicator adds the most value. When NVI disagrees with price, pay attention:
- Price makes a new low, NVI holds higher — potential bullish reversal
- Price makes a new high, NVI fails to follow — potential bearish reversal
On NVDA in early 2025, I spotted a bearish divergence on the daily NVI before the stock pulled back 12%. It wasn't the only factor, but it gave me an early warning I acted on.
4. Adding a moving average signal
I prefer a 255-period SMA on the NVI line. It smooths the noise and provides a basic trend filter:
- NVI above the SMA suggests a bullish bias
- NVI below the SMA suggests caution
You'll find similar approaches in the OBV Oscillator guide and the Price-Volume Trend guide — both use cumulative volume-based lines with moving average crossovers.
Practical settings
The NVI doesn't need much configuration. Here's what I use:
| Parameter | My Setting | Why |
|---|---|---|
| Start value | 1000 | Standard baseline |
| Signal MA | 255-period SMA | Covers roughly one trading year |
| Optional trigger | 39-period EMA | Faster signal for entries |
| Preferred chart | Daily | Best signal-to-noise ratio |
I also cross-reference NVI with the Volume Indicators guide for additional context on market participation.
What I don't like about NVI
No indicator is perfect, and I've run into several limits:
- Lag: NVI is a cumulative index. Signals arrive after price action has already started
- False divergences: Not every divergence resolves. I've had whipsaw trades on small-cap stocks
- Volume dependency: On thinly traded instruments, volume comparisons become noisy
- Forex issues: Forex volume is tick-based, not real exchange volume. I wouldn't rely on NVI for currency pairs

Backtesting NVI strategies with Pineify
Before I trust any NVI setup with real capital, I run it through Pineify's backtester. Here's my workflow:
- Define entry rules — NVI crossing above its 255-SMA with price above the 200-day MA, for example
- Set exit rules — trailing stop at 2x ATR or a fixed 15% target
- Test on historical data — I usually start with 5 years of daily data
- Review the equity curve — drawdowns over 30% tell me the system needs work
- Tweak and re-run
Pineify handles the coding so you don't need to write Pine Script manually. I've used it to build and test over a dozen indicator combinations without writing a line of code.

The Price-Volume Trend indicator is another volume-based tool I've tested inside Pineify — worth adding to your volume analysis toolkit.

▶What does the Negative Volume Index actually measure?
The Negative Volume Index (NVI) tracks cumulative price changes only on days when volume is lower than the previous day. The idea is that institutional investors trade more during low-volume periods, so NVI reflects their activity rather than the retail crowd's.
▶How is NVI different from the Positive Volume Index (PVI)?
NVI updates on low-volume days (smart money), while PVI updates on high-volume days (retail activity). Using both together gives you both sides of the market participation picture.
▶What is a good NVI divergence signal?
A bullish divergence happens when price makes a new low but NVI doesn't follow — it means institutions might be buying the dip. A bearish divergence is the opposite: price hits a new high while NVI drops, suggesting smart money is quietly selling.
▶What moving average length works best with NVI?
The 255-period SMA is the most common choice — it covers roughly one trading year on daily charts. Fosback's original research found that when NVI stays above this average, bull markets are more likely.
▶Can NVI be used for stocks, forex, or crypto?
NVI works best on stocks where volume data is reliable. It can be applied to crypto since exchanges provide trade volume. For forex, volume is tick-based rather than actual traded volume, so NVI signals are less trustworthy there.
▶How do I add the Negative Volume Index in TradingView using Pineify?
Open Pineify, search for "Negative Volume Index" in the indicator library, select it, and add it to your chart. Pineify generates the Pine Script code automatically — no manual coding required.