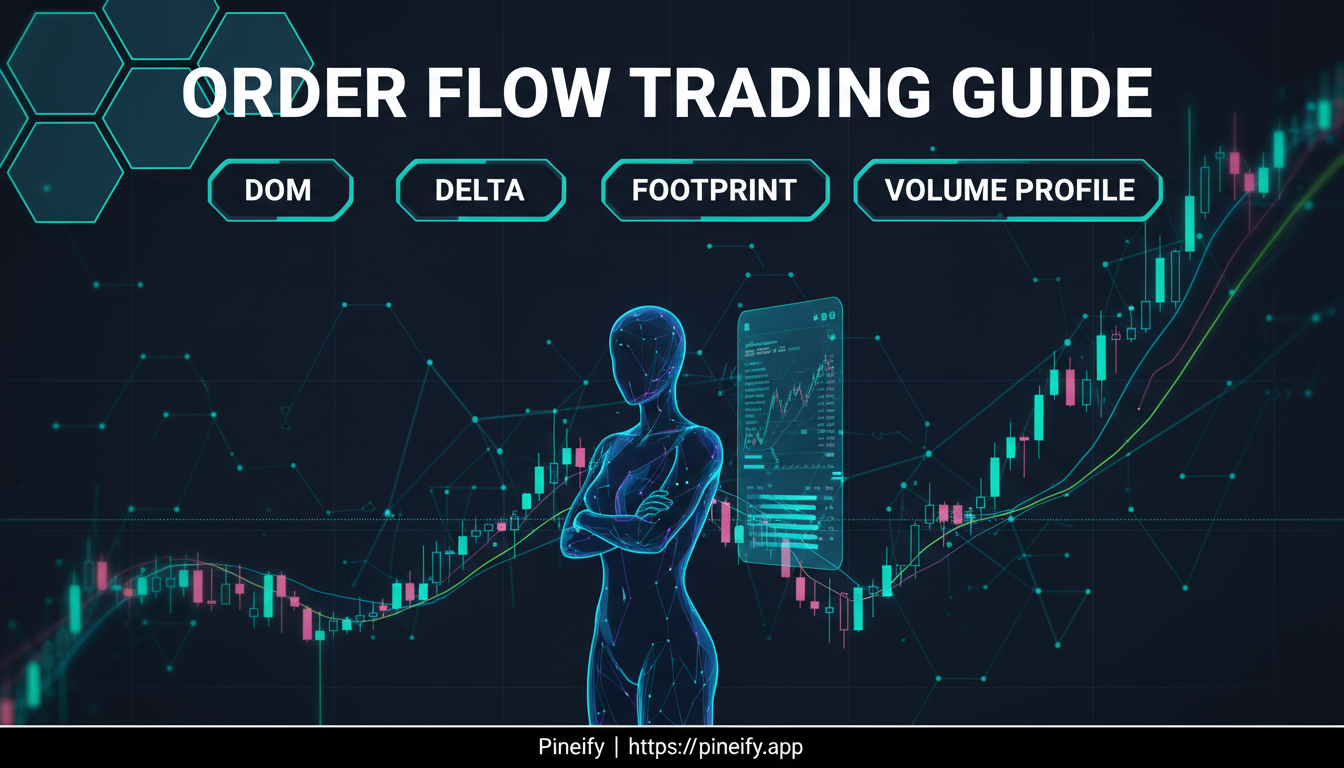
Order Flow on TradingView: DOM, Delta, Footprint, Volume Profile
· 18 min read
Order flow is the live sequence of buy and sell transactions that drives every price move on your chart. On TradingView, you watch this through the DOM, Time & Sales, footprint charts, and cumulative delta. I started focusing on these tools in early 2023, trading ES futures, and within a few weeks I could see absorption patterns I had missed for years. Not every setup works. Some signals are just noise. The trick is knowing which is which.