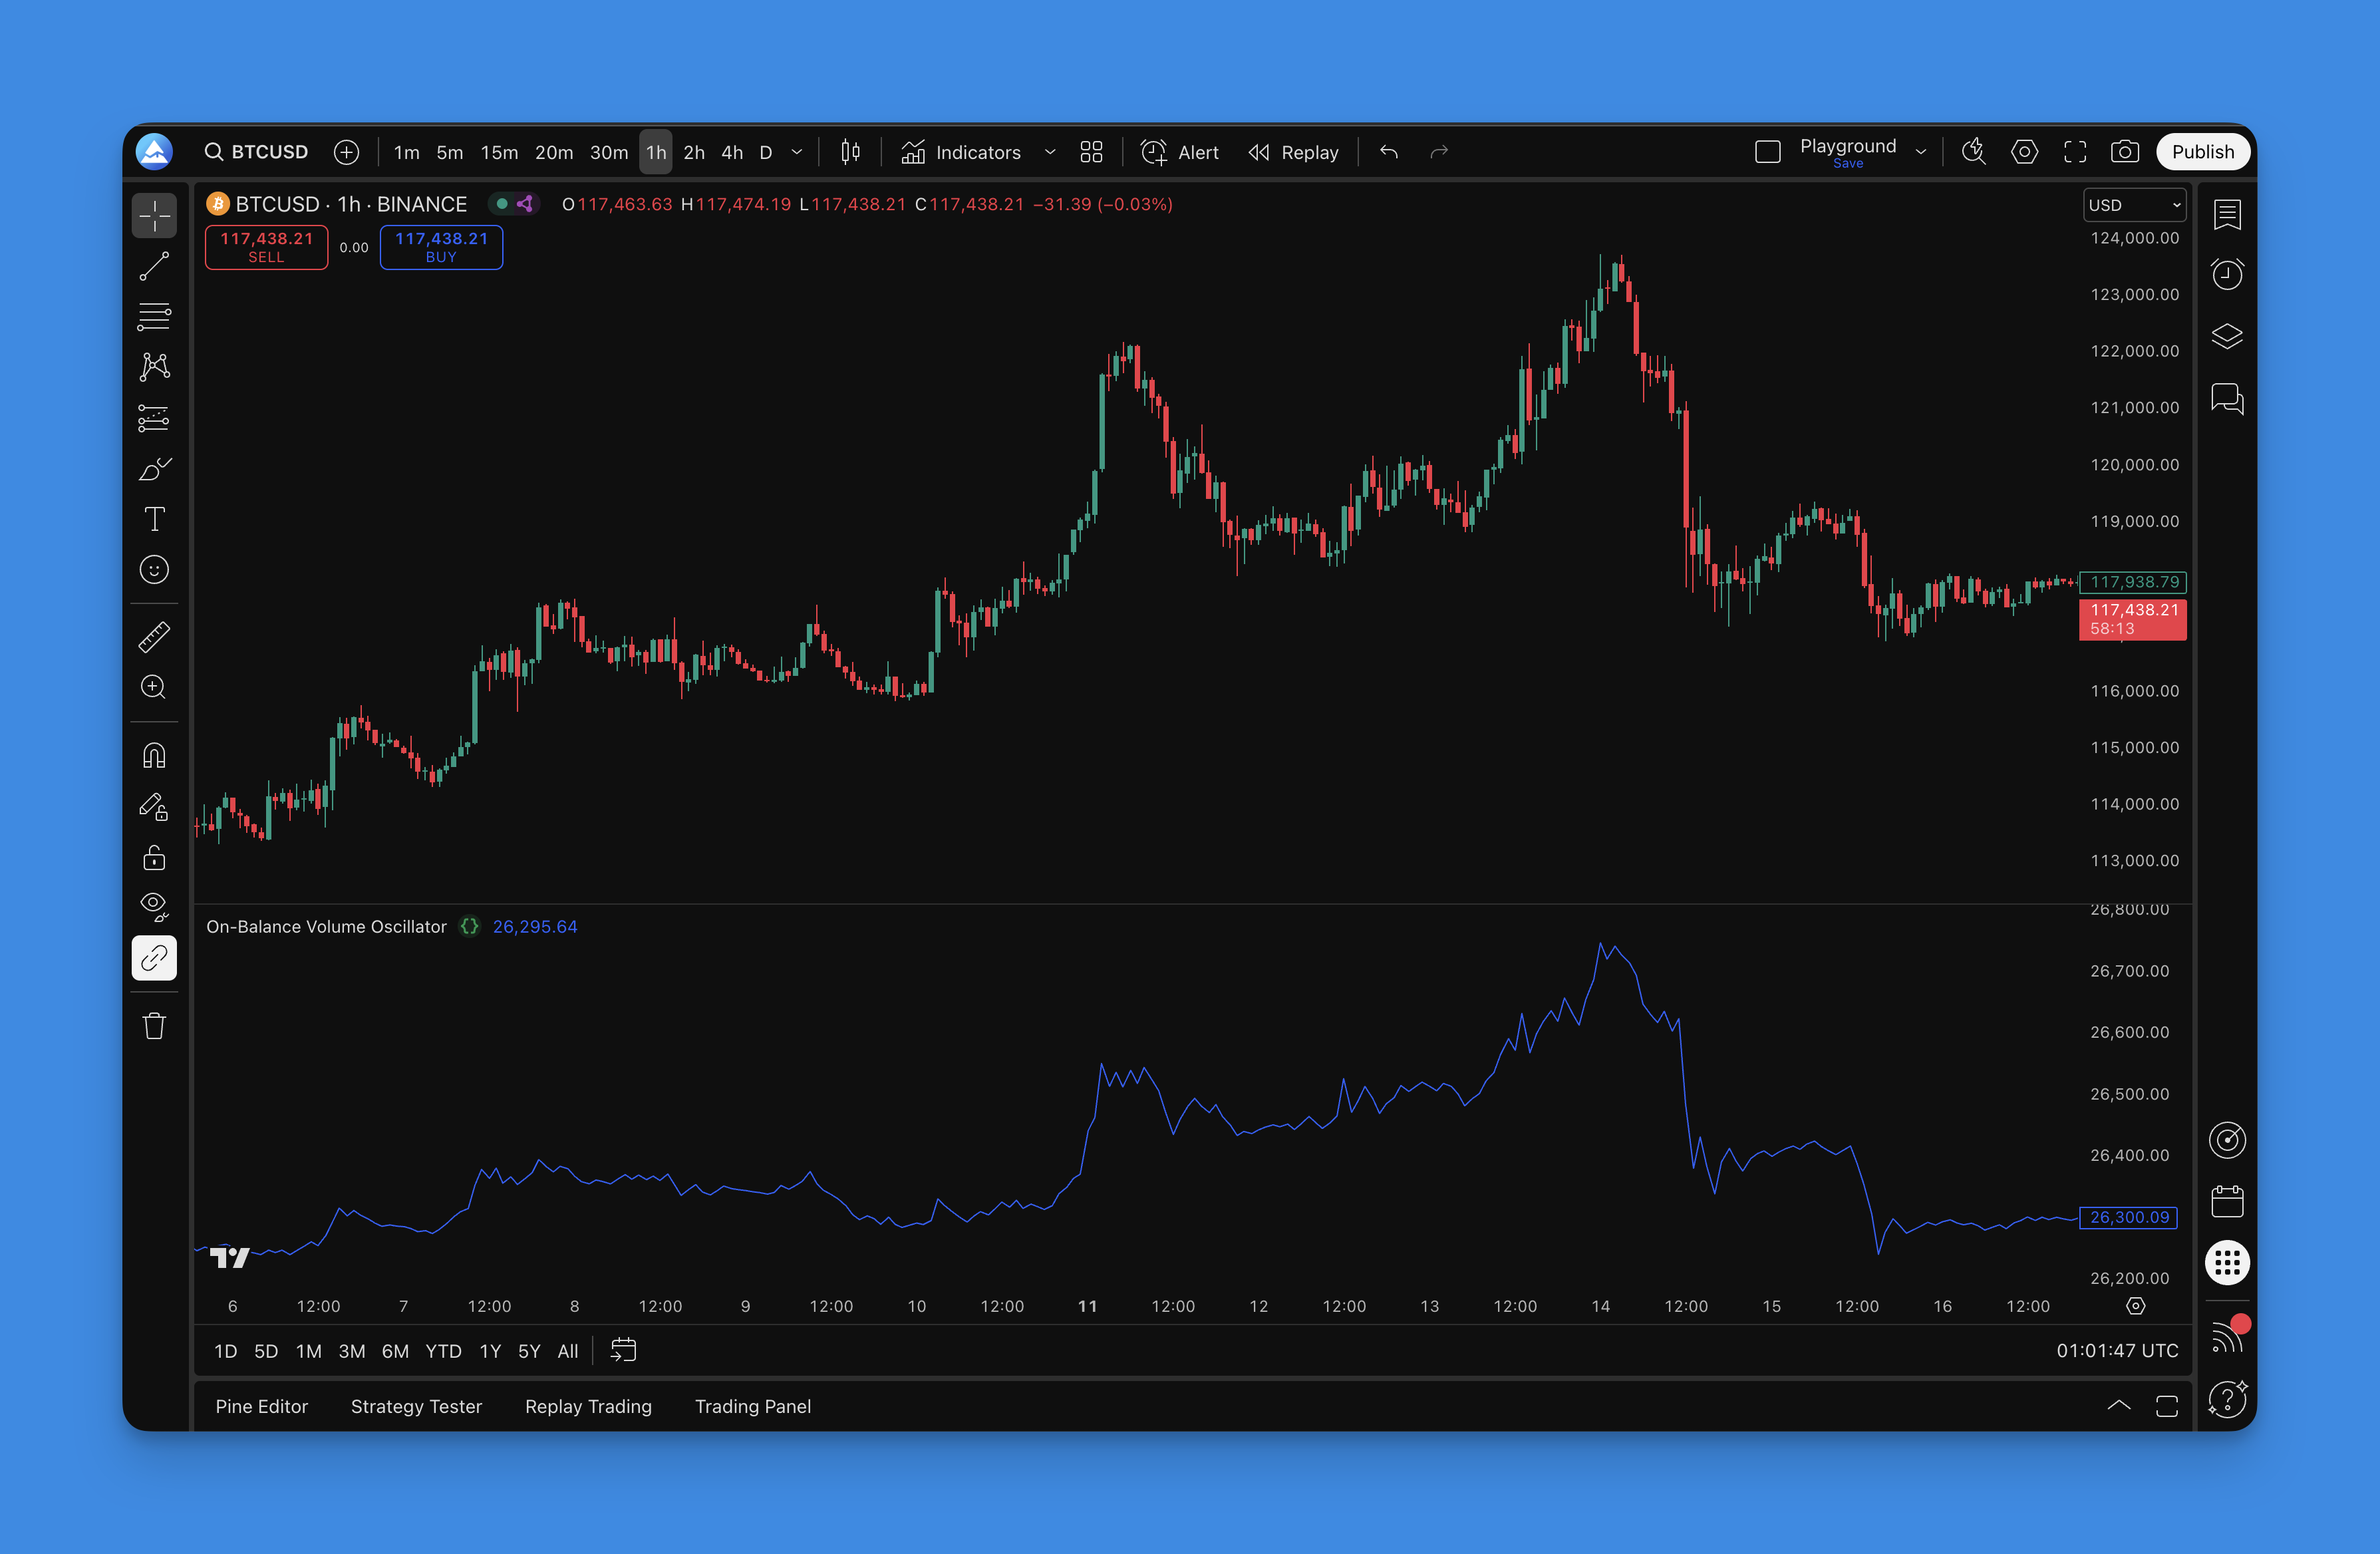
On-Balance Volume Oscillator: Spot Price Moves with OBV
You know that feeling when a stock breaks out on huge volume versus when it barely crawls higher on light trading? The On-Balance Volume (OBV) oscillator is a cumulative volume indicator that tracks buying and selling pressure by adding volume on up days and subtracting it on down days. That difference between real moves and fake ones is exactly what OBV reveals.
Developed by Joseph Granville back in the 1960s, OBV tracks the actual flow of money into and out of a security. While everyone else stares at candlesticks, OBV builds a picture of whether smart money is accumulating or distributing shares. I've been using OBV for about six years now, and it still catches moves that price alone misses.
The concept is simple. When price closes higher than the previous day, OBV adds that day's volume. When price closes lower, it subtracts it. This creates a cumulative line that often telegraphs moves days or weeks ahead.
What makes OBV useful: institutional money behaves differently than retail money. Big players can't slam the buy button - they need time to build positions without moving the market. This patient accumulation shows up in OBV before it shows up in dramatic price moves. I prefer OBV on daily charts for swing trades on names like $AAPL and $SPY, though I haven't tested it in extremely choppy low-volume conditions - those tend to generate noise.
When OBV and price move together, you're seeing genuine trend strength. When they disagree - price makes new highs while OBV doesn't, or vice versa - that's where the real trading opportunities live.
What is On-Balance Volume Oscillator?
The On-Balance Volume oscillator is like having X-ray vision for market sentiment. While most traders get caught up in the drama of price movements, OBV tracks the real story - who's actually putting their money where their mouth is.
Picture this: you're at an auction where bidders can hide their intentions. The auctioneer (price) calls out numbers, but you can't see how enthusiastic the bidding really is. OBV is like having a secret view of how much money each bidder is actually willing to commit. That's the power Joseph Granville built when he created this indicator.
The OBV Formula:
Here's what happens behind the scenes:
- Price closes higher than yesterday? Add today's entire volume to the OBV running total
- Price closes lower than yesterday? Subtract today's entire volume from the OBV total
- Price closes exactly the same? OBV stays unchanged
This creates a cumulative line that builds over time, showing you the net flow of volume-weighted sentiment.
Why OBV Actually Works:
- Volume precedes price - Smart money accumulates before obvious moves
- Confirms trend quality - Strong trends need strong volume support
- Exposes market lies - When price and volume disagree, something's up
- Universal application - Works on everything from 1-minute charts to monthly timeframes
- Institutional footprints - Large players can't hide their volume impact
The real power is that OBV measures conviction, not just volume. High volume on up days shows buyers are confident enough to pay higher prices. High volume on down days reveals sellers are motivated enough to accept lower prices.
For traders looking to combine volume analysis with other momentum tools, our Chaikin Oscillator guide shows how volume and price momentum work together in different market conditions.
How to Calculate On-Balance Volume
You could calculate OBV with a pencil and paper during lunch. No complex formulas, no statistical wizardry.
The Three-Rule System:
Rule 1: Set Your Starting Point Pick any day as your baseline. That day's volume becomes your first OBV value. Most platforms start at zero, but the actual number doesn't matter - it's the direction that counts.
Rule 2: Apply the Daily Logic Every day after that, ask yourself one simple question: "Did price close higher or lower than yesterday?"
- Higher close? Add today's volume to your running OBV total
- Lower close? Subtract today's volume from your running OBV total
- Same close? Do nothing - OBV stays put
Rule 3: Keep Building Repeat this process day after day. You're keeping a running scorecard of volume-weighted market sentiment.
Real-World Example (Tracking Tesla):
| Day | Close | Volume | What Happened | OBV Math | Running OBV |
|---|---|---|---|---|---|
| Mon | $200 | 2M | Starting day | Baseline | 2,000,000 |
| Tue | $205 | 3M | Price up | 2M + 3M | 5,000,000 |
| Wed | $202 | 1.5M | Price down | 5M - 1.5M | 3,500,000 |
| Thu | $208 | 2.5M | Price up | 3.5M + 2.5M | 6,000,000 |
| Fri | $208 | 1M | No change | No change | 6,000,000 |
The Story Behind the Numbers: Look at Wednesday - price dropped $3, but OBV fell by 1.5 million. Thursday's $6 gain added 2.5 million to OBV. That tells you Thursday's buyers were more committed than Wednesday's sellers. That's insight you can't get from price alone.
The genius is in the simplicity. You're not predicting the future - you're tracking whether volume flows with or against the price trend.
For a deeper look at how volume shapes market structure, check out our volume profile guide.

How to Add On-Balance Volume Oscillator to TradingView?
Getting OBV on your charts takes about 2 minutes, not 2 hours. I've tested both methods, and here's what works.
Method 1: The Professional Route (Recommended)
- Head to Pineify - Visit Pineify.app and create your account
- Find OBV in the library - Search "On-Balance Volume" in the indicator collection
- Get your code - The platform generates clean, optimized Pine Script
- Deploy to TradingView - Copy the code into TradingView's Pine Script Editor

Why This Method Wins:
The Pineify version gives you professional-grade OBV with clean visualization, proper scaling, and customization options you won't find in the basic version. Plus you get the code to modify later.
Method 2: The Quick Route
TradingView has a built-in OBV indicator. Click the indicators button, search "On Balance Volume," and add it. Takes 30 seconds, but you're stuck with basic functionality.
What Can Go Wrong:
The biggest mistake new users make is overlaying OBV on the price pane instead of keeping it in a separate pane below. That makes the line impossible to read properly. Also, if your TradingView plan doesn't include Pine Script access, the custom version won't work on that account.
Setting It Up Right:
Once you've added OBV:
- Position: Keep it in a separate pane below price
- Colors: Use contrasting colors against your chart background
- Scale: Let it auto-scale so you can see the full range
First-Timer Tip: If you're new to custom indicators, our beginner's Pine Script guide walks through the entire process step-by-step. No technical background required.
How to Use On-Balance Volume Oscillator?
Having OBV on your chart is one thing - reading its signals and turning them into trades is another. Let me break down the patterns that work when real money's on the line.
What OBV Tells You:
- Rising OBV = Smart money is accumulating (bullish undercurrent)
- Falling OBV = Smart money is distributing (bearish undercurrent)
- Flat OBV = Institutional indecision (wait for clarity)
Trend Confirmation:
This is OBV's bread and butter:
- Strong uptrend: Price climbing + OBV climbing = green light
- Strong downtrend: Price falling + OBV falling = red light
- Weak trend: Price moving but OBV flat or opposite = yellow light
Divergence Trading (Where the Real Money Is):
This is the holy grail of OBV signals - when price and volume tell different stories:
Bullish Divergence Setup:
- Price keeps making lower lows
- OBV starts making higher lows
- Translation: Smart money is quietly buying the dips
Bearish Divergence Setup:
- Price keeps making higher highs
- OBV starts making lower highs
- Translation: Smart money is quietly selling the rallies
Breakout Validation:
Use OBV to filter out false breakouts:
- Legitimate breakout: Price breaks key level + OBV surges = high probability
- Suspicious breakout: Price breaks but OBV barely moves = low probability
- False breakout: Price breaks but OBV moves opposite = avoid
Volume Surge Signals:
Sudden OBV movements often precede major price moves:
- Sharp OBV spike up = Institutional buying pressure building
- Sharp OBV drop = Institutional selling pressure building
Market Phase Recognition:
OBV reveals which phase you're in:
- Accumulation Phase: OBV climbing while price moves sideways
- Distribution Phase: OBV falling while price moves sideways
- Markup Phase: Both price and OBV rising together
- Markdown Phase: Both price and OBV falling together
My Real-World Trading Rules:
After years with OBV, here's what I've found works:
- Never trade OBV signals in isolation - Always combine with price action and at least one momentum indicator. I prefer pairing it with RSI on the daily chart.
- Wait for confirmation - Don't jump on the first divergence you see. Wait for price to start moving in OBV's direction.
- Use multiple timeframes - I check that my OBV signal aligns across daily and 4-hour before taking a position.
- Respect the trend - OBV works best as a trend continuation tool, not a reversal predictor. I've lost money trying to catch reversals based on OBV alone - don't make that mistake.
Pro Tip: The strongest signals happen when OBV, price action, and momentum indicators all tell the same story. When they disagree, step aside and wait.
Our Money Flow Index guide shows how to combine volume with price momentum for even more precise market timing.
Best On-Balance Volume Oscillator Settings
OBV is one of the few indicators where "more complex" doesn't mean "more profitable." The standard calculation has stood the test of time.
Core Settings:
- Price comparison: Use closing prices
- Volume inclusion: Include all volume data
- Starting baseline: Zero works fine
- Calculation method: Standard cumulative approach
Timeframe Strategy:
This is where most traders get it wrong:
- Scalping/Day Trading: 5-minute to 1-hour charts
- Swing Trading: 4-hour to daily charts (my sweet spot)
- Position Trading: Daily to weekly charts
- Multi-timeframe approach: Use daily for trend, hourly for timing
Visual Setup:
- Rising OBV: Green or blue
- Falling OBV: Red or orange
- Flat OBV: Gray
- Line thickness: 2-3 pixels
- Line style: Solid
- Position: Own pane below price
- Scaling: Auto-scale enabled
Market-Specific Notes:
Stocks: Standard settings work well. Watch during earnings weeks when volume spikes can distort signals.
Forex: Use with caution - volume data isn't as reliable. Stick to major pairs and longer timeframes (4H+). I'd treat it as secondary confirmation here, not primary.
Crypto: OBV works well due to transparent 24/7 volume data. Good for spotting whale accumulation.
Commodities: Standard settings work. Be aware of seasonal patterns.
Advanced Tweaks:
Moving Average Smoothing: Some traders overlay a moving average on the OBV line:
- 10-period MA: Quick signals but more false positives
- 21-period MA: Balanced for swing trading
- 50-period MA: Smooth for position trading
Multi-Timeframe Analysis:
- Weekly OBV: Overall direction
- Daily OBV: Primary trend confirmation
- 4-hour OBV: Entry and exit timing
- 1-hour OBV: Fine-tuning (day traders only)
Honest Assessment:
I've tested countless OBV variations. The standard calculation beats the "optimized" versions almost every time. The indicator's strength lies in its simplicity.
What Actually Moves the Needle:
- Signal recognition - learning to spot real divergences vs. noise
- Confirmation skills - combining OBV with price action
- Risk management - proper position sizing and stops
- Practice - paper trading before risking real capital
Spend 90% of your time learning to read OBV signals correctly and 10% tweaking settings. Most traders do the opposite.
Our Pine Script fundamentals guide provides the foundation for building custom OBV variations.
How to Backtest On-Balance Volume Oscillator?
Most traders fall in love with OBV after seeing a few good signals on recent charts, then get burned trading it live. Don't make that expensive mistake.
Building Your Test Strategy:
Using Pineify's backtesting engine, you can build complete strategies with proper entry/exit rules and risk management.
Basic Entry Signals to Test:
Trend Following Setup:
- Long entry: OBV breaks above recent swing high + price confirms with resistance break
- Short entry: OBV breaks below recent swing low + price confirms with support break
- Volume filter: Only trade when current volume exceeds 20-day average
Divergence Strategy:
- Bullish divergence: Price lower low, OBV higher low, enter on price reversal
- Bearish divergence: Price higher high, OBV lower high, enter on price reversal
- Patience required: Wait for price confirmation before entering
Breakout Confirmation:
- Setup: Price approaches key support/resistance
- Confirmation: OBV must surge in breakout direction
- Entry: Enter only when both price AND OBV break together
Exit Rules:
Stop Loss Framework:
- Technical stops: Place just beyond recent swing highs/lows
- OBV stops: Exit if OBV breaks key support/resistance in opposite direction
- Risk limit: Never risk more than 1-2% of account per trade
- Time stops: Exit if trade doesn't move favorably within 5-10 bars
Profit Taking:
- Target 1: Previous support/resistance levels (take 50% off)
- Target 2: Next major technical level (take remaining 50%)
- Risk-reward: Aim for minimum 2:1, preferably 3:1
- Trailing method: Use OBV trend changes as trailing stop signals
Risk Management:
Position Sizing:
- Starting size: 0.5-1% risk per trade
- Scaling up: After 20+ profitable trades with consistent results
- Scaling down: Reduce after 3 consecutive losses
- Maximum exposure: Never more than 5% total account at risk
Market Environment Filters:
- Best conditions: Clear trending markets with consistent volume
- Avoid: Choppy, low-volume, news-driven markets
- Trend filter: Only trade in direction of higher timeframe trend
- Volatility filter: Reduce size during high volatility
Testing Across Conditions:
Bull Market: OBV typically leads price. Focus on bullish divergences and upside breakouts. Expect 60-70% win rates but smaller gains.
Bear Market: OBV signals distribution before declines. Test bearish divergences and breakdowns. Lower win rates (40-50%) but larger wins.
Sideways Market: More false signals. Reduce position sizes by 50%. Consider avoiding OBV signals in tight ranges.
Critical Metrics:
- Win rate: Target 45-65%
- Risk-reward: Minimum 1.5:1, ideally 2:1+
- Max drawdown: Keep under 15-20%
- Profit factor: Aim for 1.3+
- Sharpe ratio: Higher is better
Using Pineify for Testing:
- Historical testing: Years of data in minutes
- Multi-timeframe: Test across different chart periods
- Parameter optimization: Fine-tune entry/exit rules
- Performance reporting: Detailed metrics and visual analysis
My Testing Protocol:
- Start simple - test basic OBV signals first
- Add complexity gradually - only if it improves risk-adjusted returns
- Out-of-sample testing - always test on unseen data
- Paper trade extensively - prove it works before risking capital
For more on strategy development, our complete backtesting guide covers advanced methodologies for building sound trading systems.
Frequently Asked Questions
▶What is the On-Balance Volume (OBV) oscillator and how does it work?
The OBV oscillator is a cumulative volume indicator that adds volume on up days and subtracts it on down days. The resulting line shows whether volume flows into or out of a security, revealing buying and selling pressure that often leads price movements.
▶How do I identify a bullish OBV divergence?
Price makes a lower low but OBV makes a higher low. That means smart money is accumulating shares even as price dips, signaling a potential reversal. Wait for price to confirm the turn before entering.
▶Can OBV be used on cryptocurrency and forex markets?
OBV works well on crypto because volume data is transparent and 24/7 - great for spotting whale accumulation. For forex, use it cautiously on major pairs with longer timeframes (4H+), treating it as secondary confirmation since tick volume is less reliable.
▶What is the best timeframe to use with the OBV oscillator?
Depends on your style. Day traders use 5-min to 1-hour. Swing traders (myself included) favor 4-hour to daily. Position traders use daily to weekly. A multi-timeframe approach - daily for direction, hourly for timing - tends to produce the most reliable signals.
▶How do I confirm a price breakout using OBV?
A legitimate breakout shows a surge in OBV in the same direction. If price breaks a key level but OBV barely moves or goes the other way, treat it as suspicious. Only take entries where both price and OBV confirm together.
▶Should OBV be used alone or combined with other indicators?
Don't use OBV alone. The strongest signals come when OBV aligns with price action and at least one momentum indicator like RSI or MACD. Divergences confirmed by a momentum shift and a support/resistance level are far more reliable.
▶What does it mean when OBV rises while price moves sideways?
That's an accumulation phase - institutions are quietly building positions without pushing price higher. It often precedes a significant upside breakout once the accumulation is complete.