DXtrade TradingView Integration: What Brokers Actually Need to Know
· 12 min read
Here's the thing—I've watched three different brokers try to cobble together "next-gen" charting solutions in the past year. Two of them ended up with Frankenstein monsters that cost more than they made. The third? They actually pulled it off with DXtrade and TradingView. Not because they're geniuses, but because someone finally told them the truth about what this integration really involves.
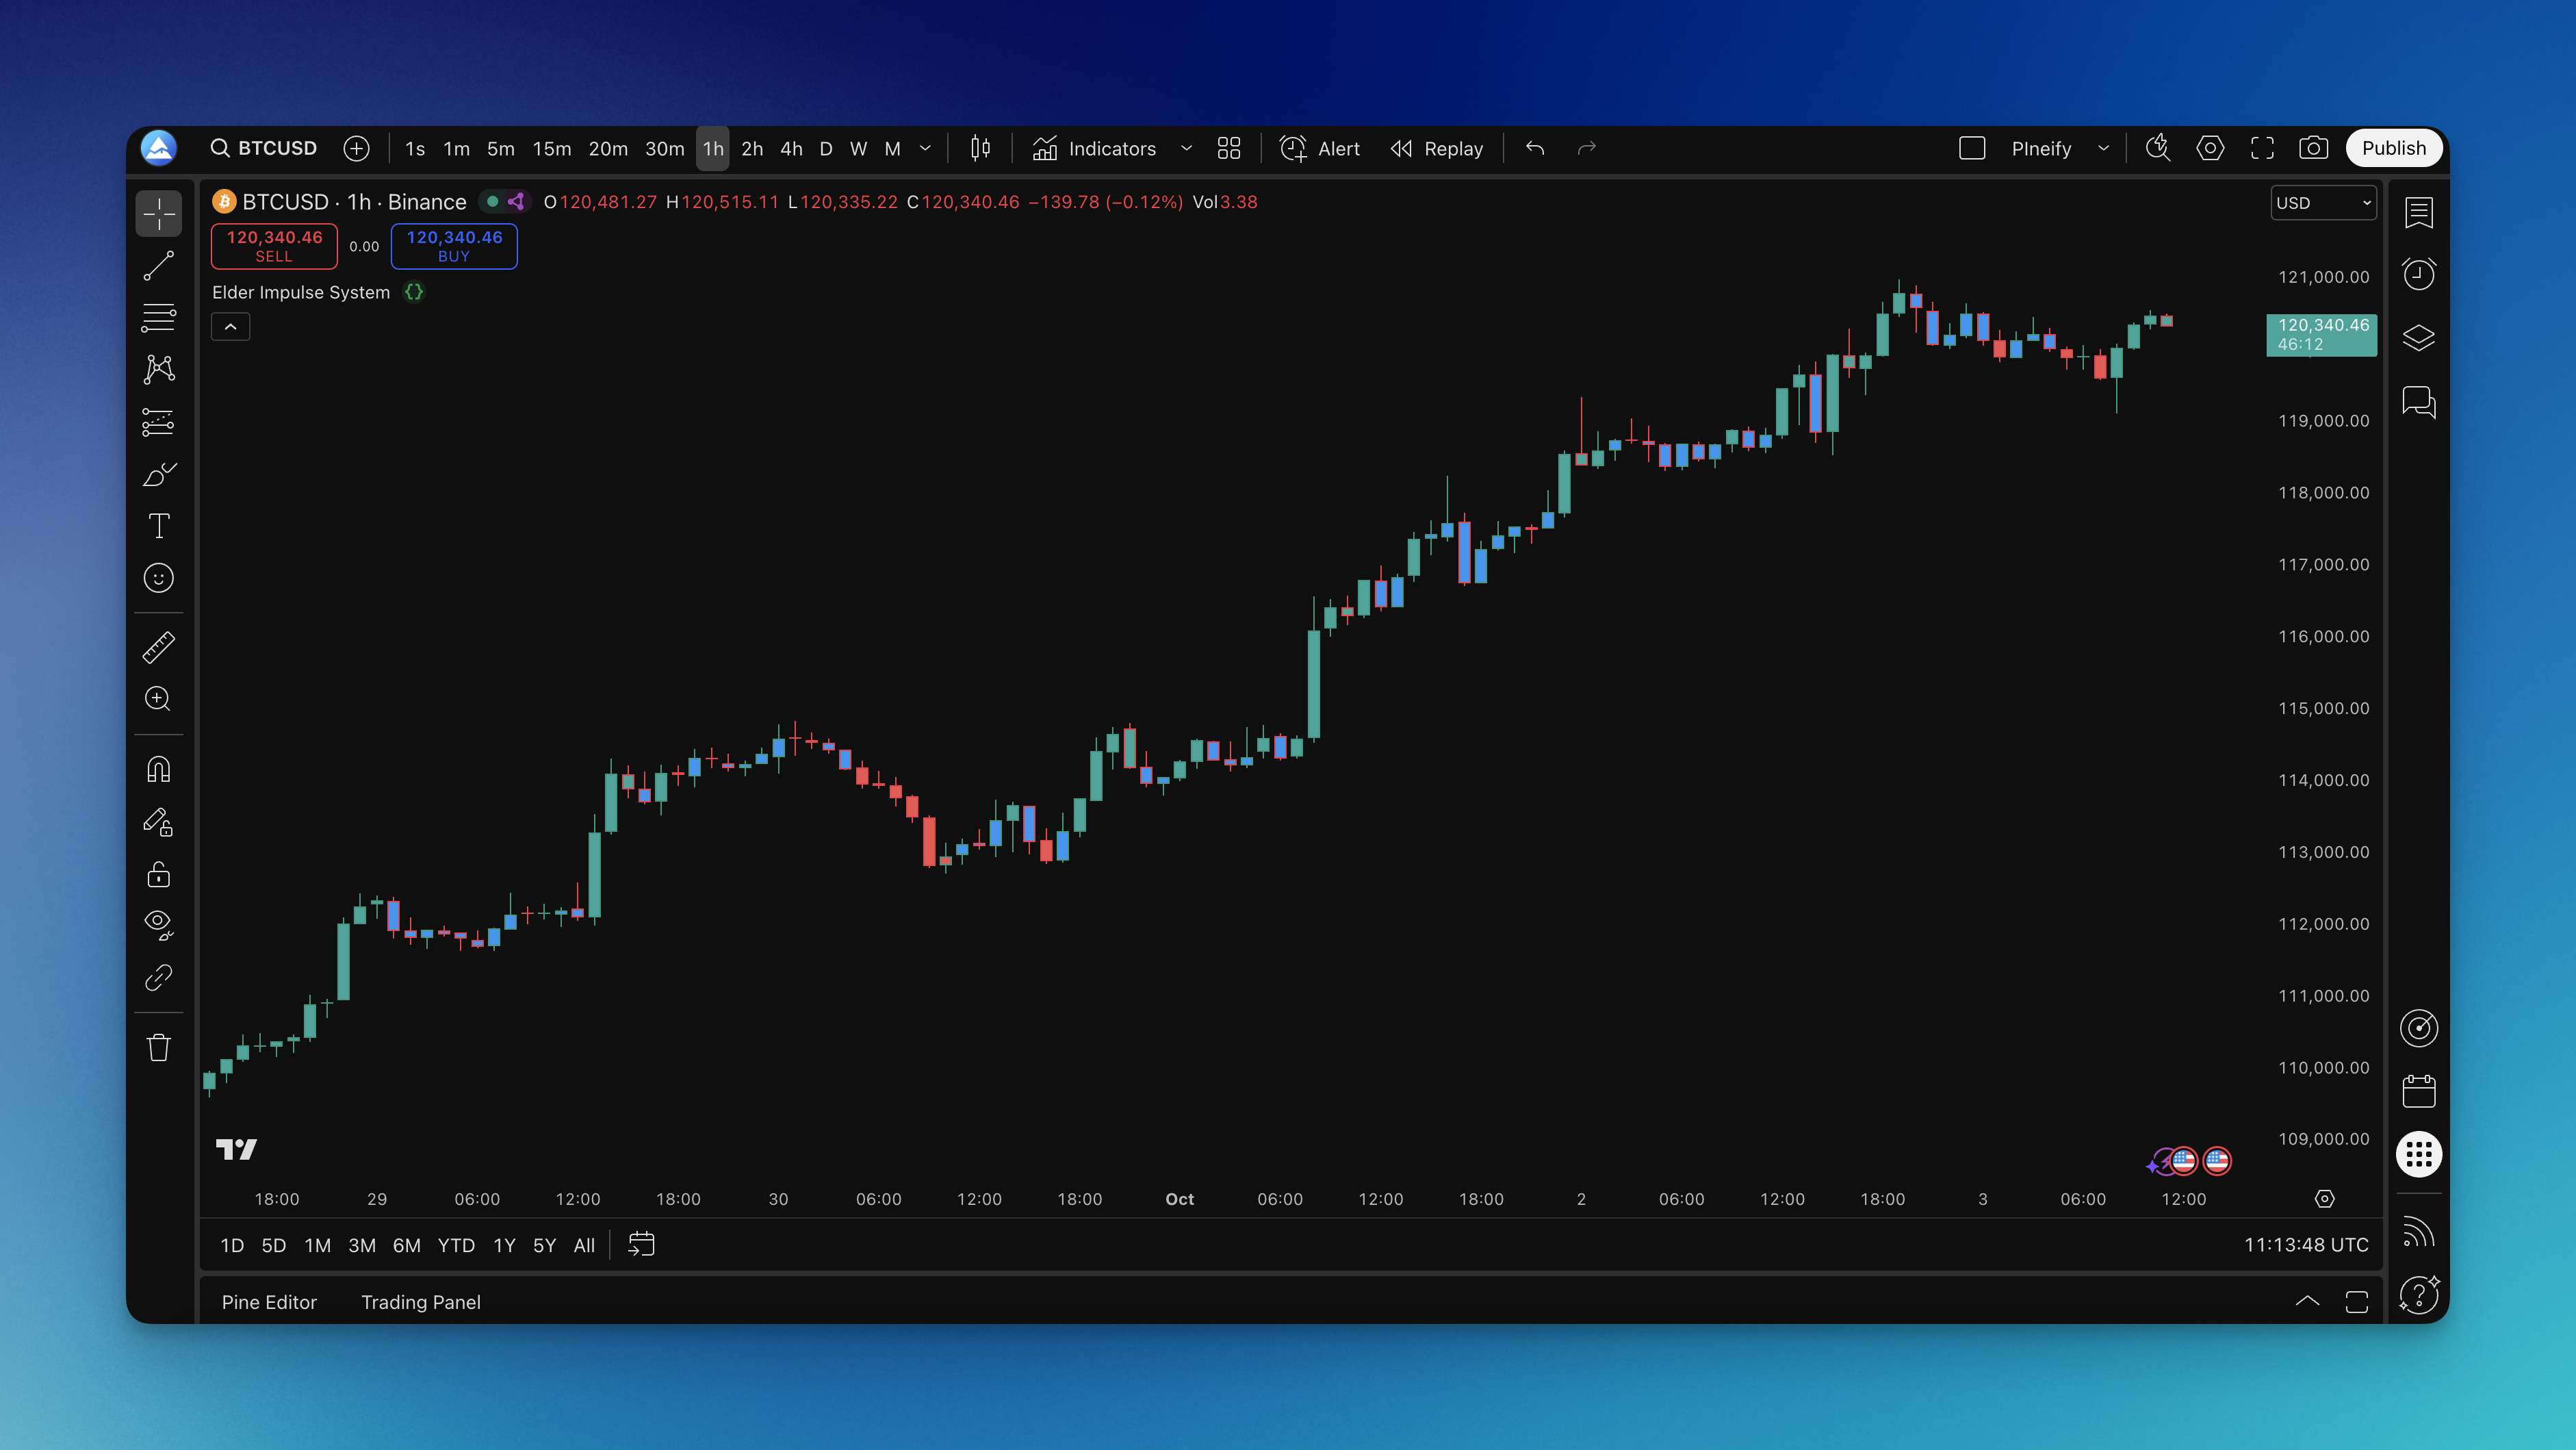
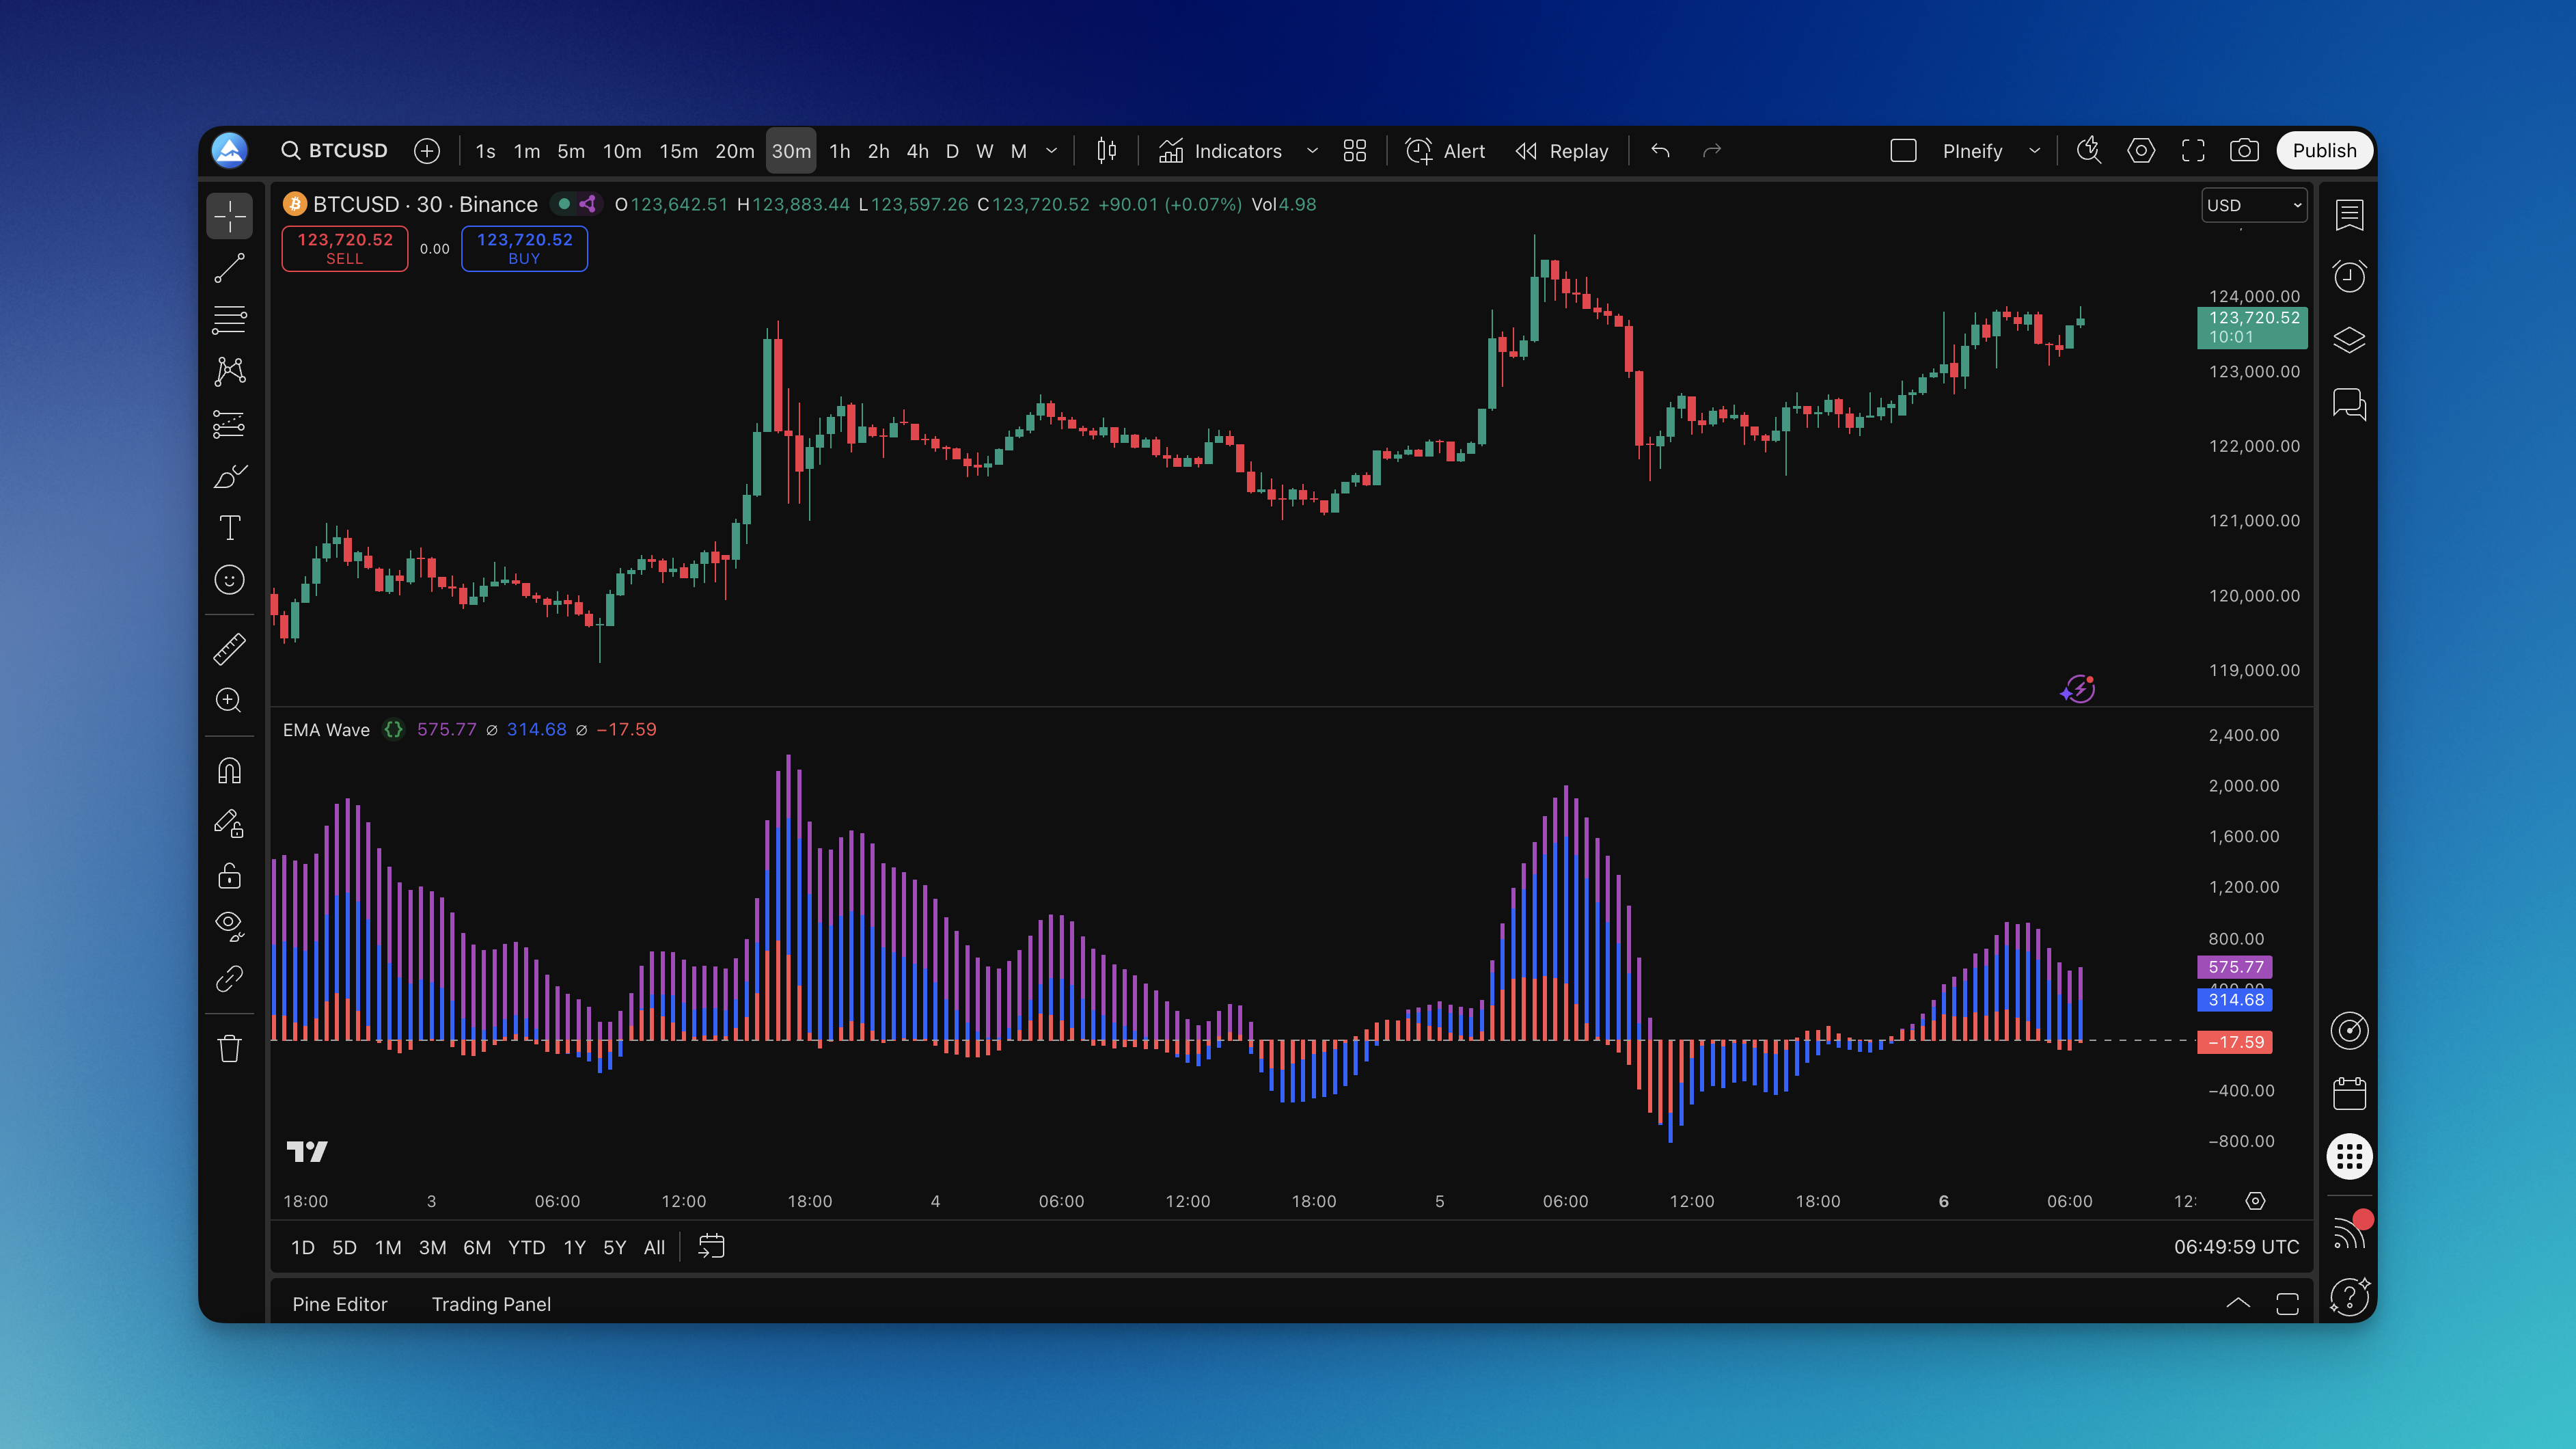
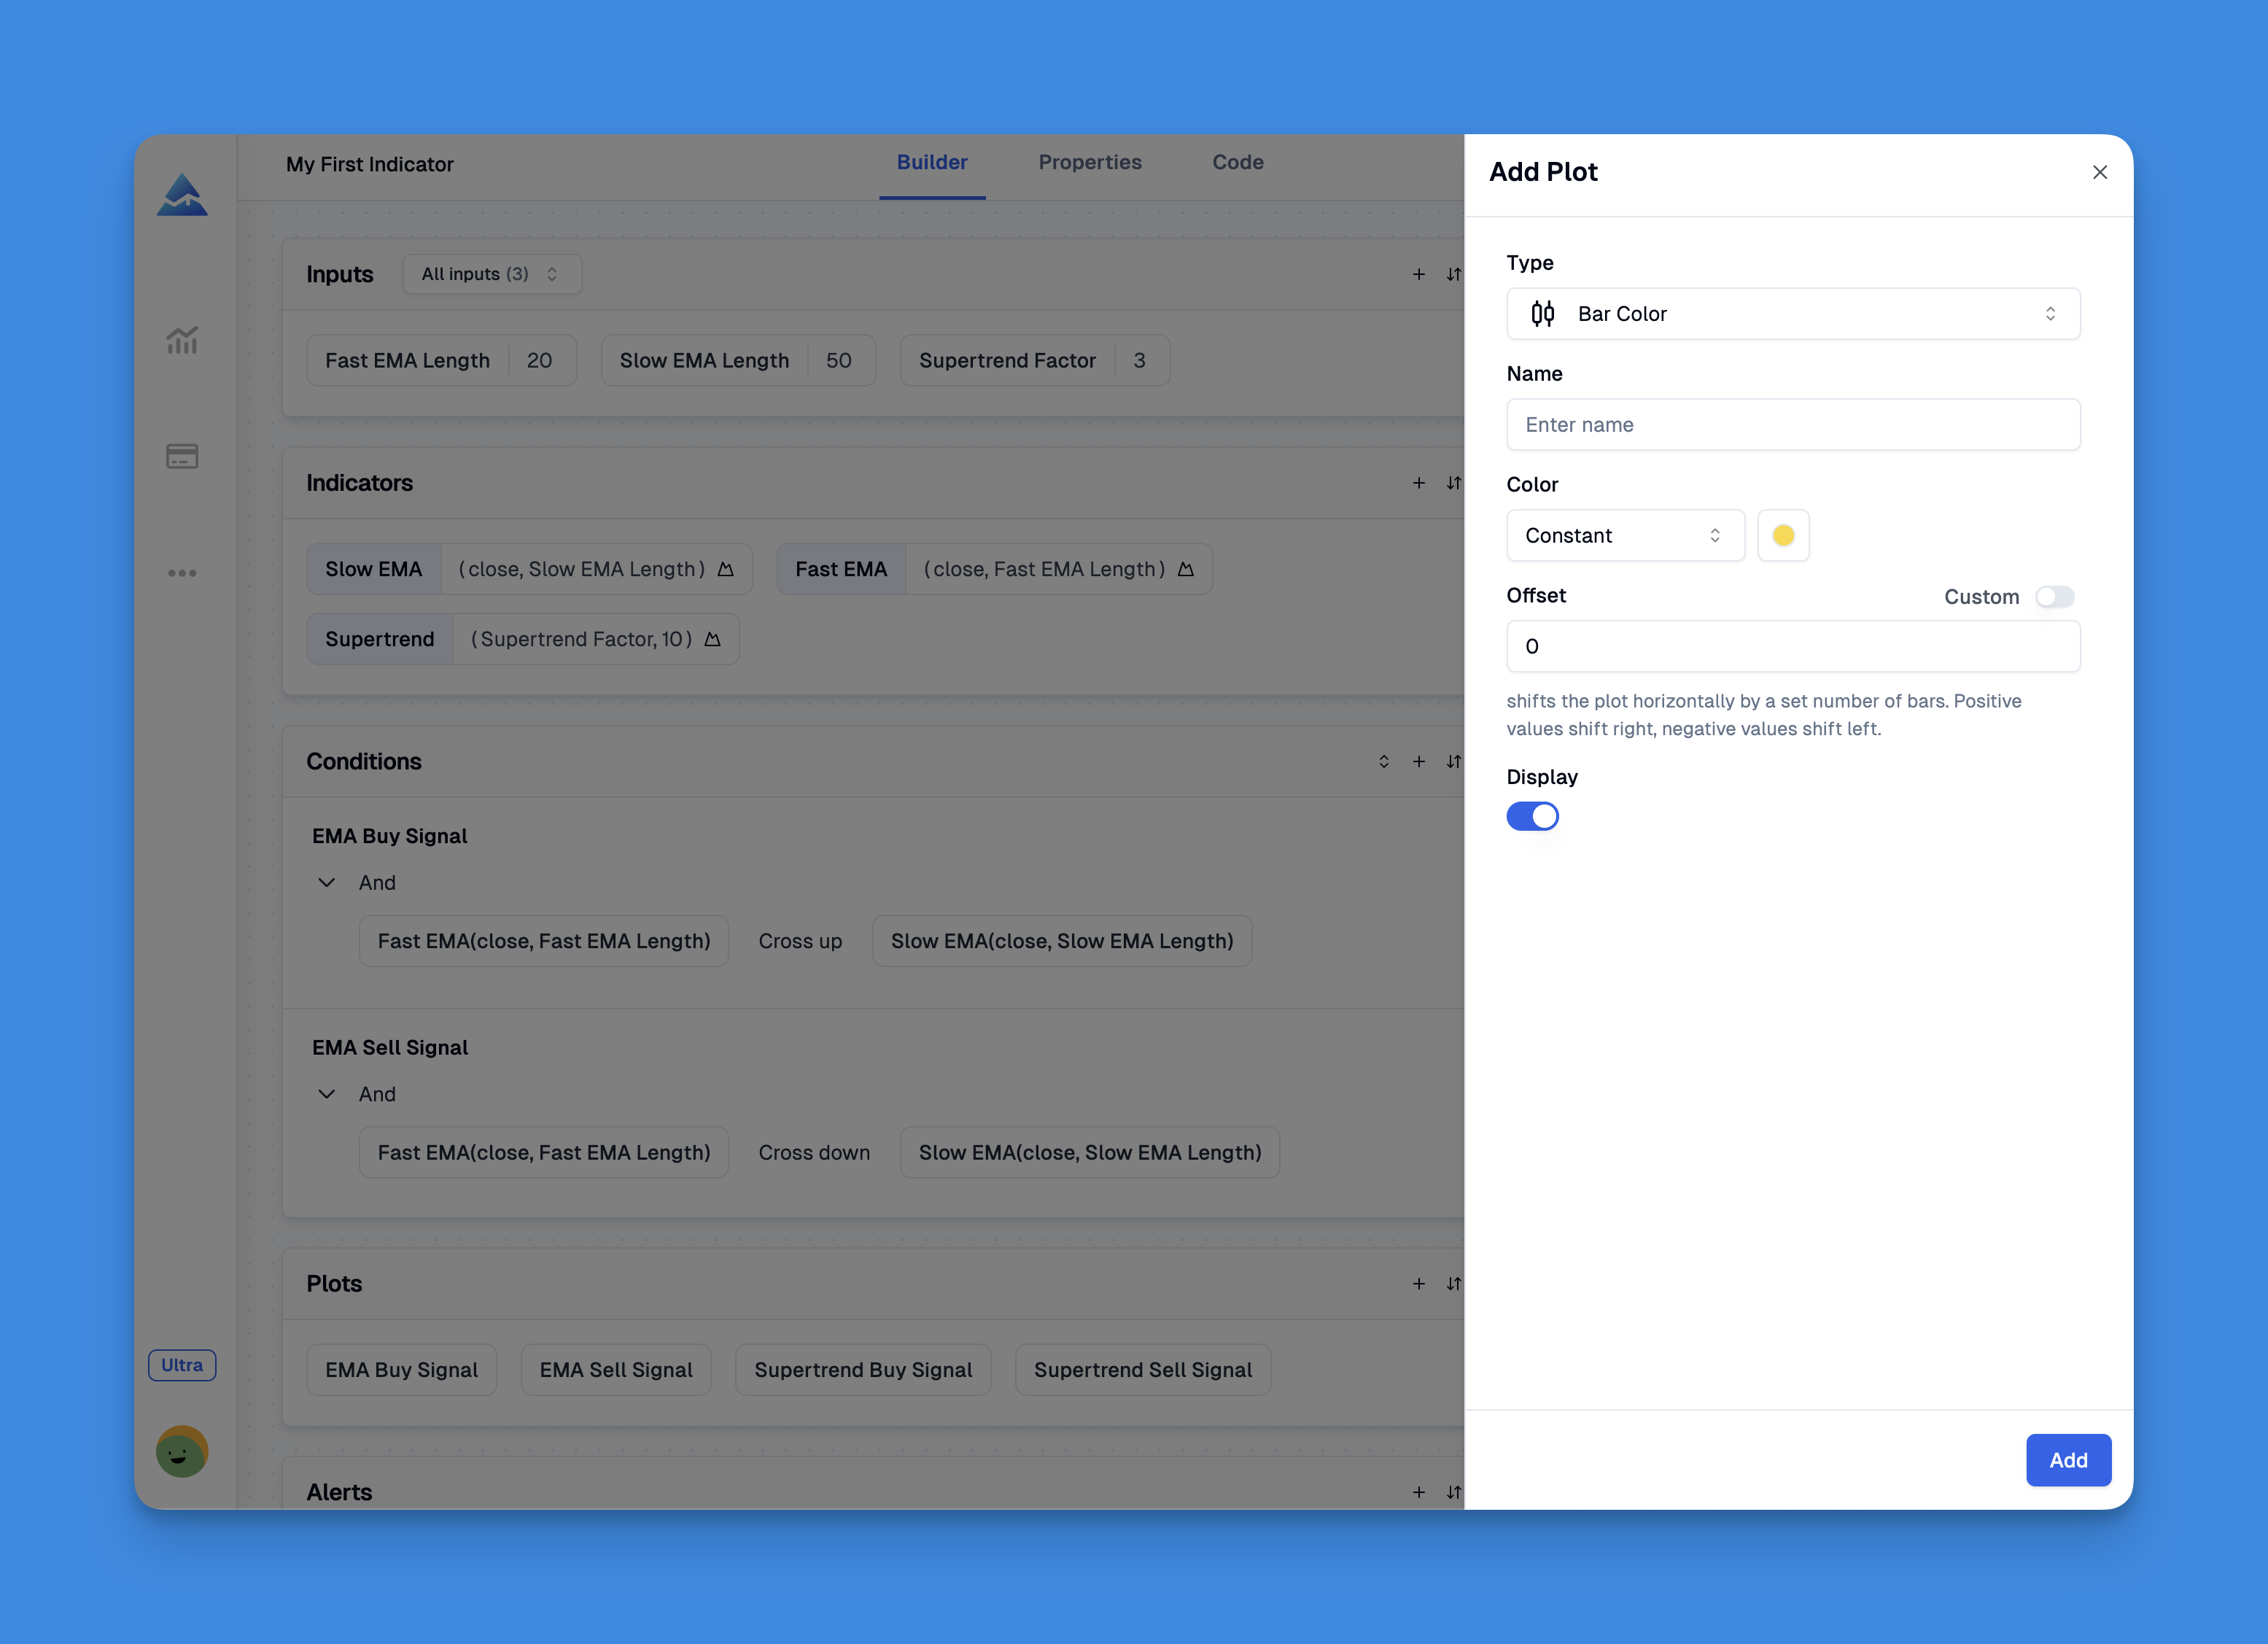
TradingView is the dominant charting platform for retail traders, used by over 50 million people each month. DXtrade is Devexperts' cloud-native brokerage engine launched in 2020. Together, they create a charting-to-execution pipeline that brokers have been chasing for years.