Institutional-Grade TradingView Signals for Market Reversals
Knowing when a market is getting ready to turn is what keeps traders profitable. It's the difference between catching a move and watching your gains disappear. Institutional-grade trading signals are price alerts that require multiple independent factors — trend direction, momentum strength, and volatility — to agree before triggering. On TradingView, indicators built on this confluence principle can sharpen your timing significantly. I rely on Pineify daily on my ES futures and AAPL charts, and the system brings together both trend spotting and reversal detection in one view.
Why It's So Hard to Spot a Reversal
The issue most traders face isn't a shortage of information — it's too much of it, and it's all saying different things. Picture this: your chart shows the MACD turning bullish just as the RSI says the asset is overbought, while the price pushes against the Bollinger Band edge. Every tool points somewhere else, and you're left stuck, unsure what to do next.
This "indicator overload" is a huge reason why trading results can be so up and down. When your tools contradict each other, you lose confidence. That leads to either missing the good setups or jumping into bad ones on a whim. The fix isn't to add one more flashing indicator to the screen. It's about using a smarter approach that combines the important signals into one clear, high-confidence read. This is similar to the approach taken by advanced tools like the VWAP Standard Deviation Bands v2, which synthesizes price and volume data into a unified view of support and resistance.
The Foundation: Classic Indicators Worth Knowing
The classic indicators you've probably seen form the foundation. Each one has a specific job and a known blind spot.
| Indicator | Primary Use | Known Limitation |
|---|---|---|
| RSI (Relative Strength Index) | Spots when an asset might be overbought or oversold | Can get stuck in extreme zones for a long time during strong trends, giving false signals. |
| MACD | Helps identify changes in trend direction and momentum | It's a lagging indicator, so by the time it signals a change, a big move has often already happened. |
| Bollinger Bands | Measures volatility and pinpoints where price might break out of a range | The bands don't tell you which direction price will go — just that it's near the edge of its recent range. |
| Fibonacci Retracement | Maps out potential support or resistance levels based on key price swings | It all depends on which two points you pick to draw it, which can be a bit subjective. |
| VWAP | Shows the average price traded throughout the day, weighted by volume | Its main power is during the trading day; it loses much of its relevance on longer-term charts. |
| Ichimoku Cloud | Gives a full picture of trend, momentum, and support/resistance all at once | There's a lot going on, which can be overwhelming if you're just starting out. |
The thing is, each of these tools works on its own. But using just one is like trying to trade with only a compass and no map — you get some information but miss the full picture.
Manually combining signals from all these indicators takes hours of screen time and a cool head. Professional trading floors use systematic rules to bring factors together because the manual approach is too slow and inconsistent. I spent three months trading SPY with just RSI and MACD and never broke 55% win rate. A unified approach makes more sense.
Modern tools solve this problem. Platforms like Pineify let you visually combine RSI, MACD, and Bollinger Bands into a single strategy without manual coding. It turns the complex task of synthesizing multiple signals into a systematic process. Our free Pine Script V5 User Manual PDF is a good resource if you want to understand the underlying code.

What "Institutional-Grade" Signals Really Are
You'll hear the term "institutional-grade" thrown around a lot. It sounds fancy, but what does it actually mean? At its core, it's about confirmation. Big funds and professional traders don't make a move just because one little indicator flashes green.
Think of it like getting a second opinion, or even a third. Instead of relying on a single tool, they combine several independent checks to see if they all tell the same story. They look at the overall trend, the strength behind a move, how much volume is involved, and the current market environment — all at once.
Here's what that looks like in practice:
- Multiple Agreements: A trade only gets the green light when several different indicators point in the same direction. One indicator by itself isn't trusted.
- Trend Filter: All signals are first checked against the bigger-picture trend. This helps avoid getting caught in a quick reversal against the main flow.
- Volume or Volatility Check: A signal needs a power boost from either a spike in trading volume or a shift in market volatility before it's considered valid.
- Built-in Risk Management: The risk level and stop-loss (often based on how jumpy the market is) are calculated as part of the signal itself. You're not figuring it out after you've already decided to trade.
This whole process is designed to filter out the noise. It ignores the shaky, false-start signals that often lead to quick losses. You might get fewer trading ideas this way, but the ones you do get have a much stronger foundation. When I tested this approach on TSLA, the multi-timeframe filter caught five false breakouts in a single week before confirming a real entry.
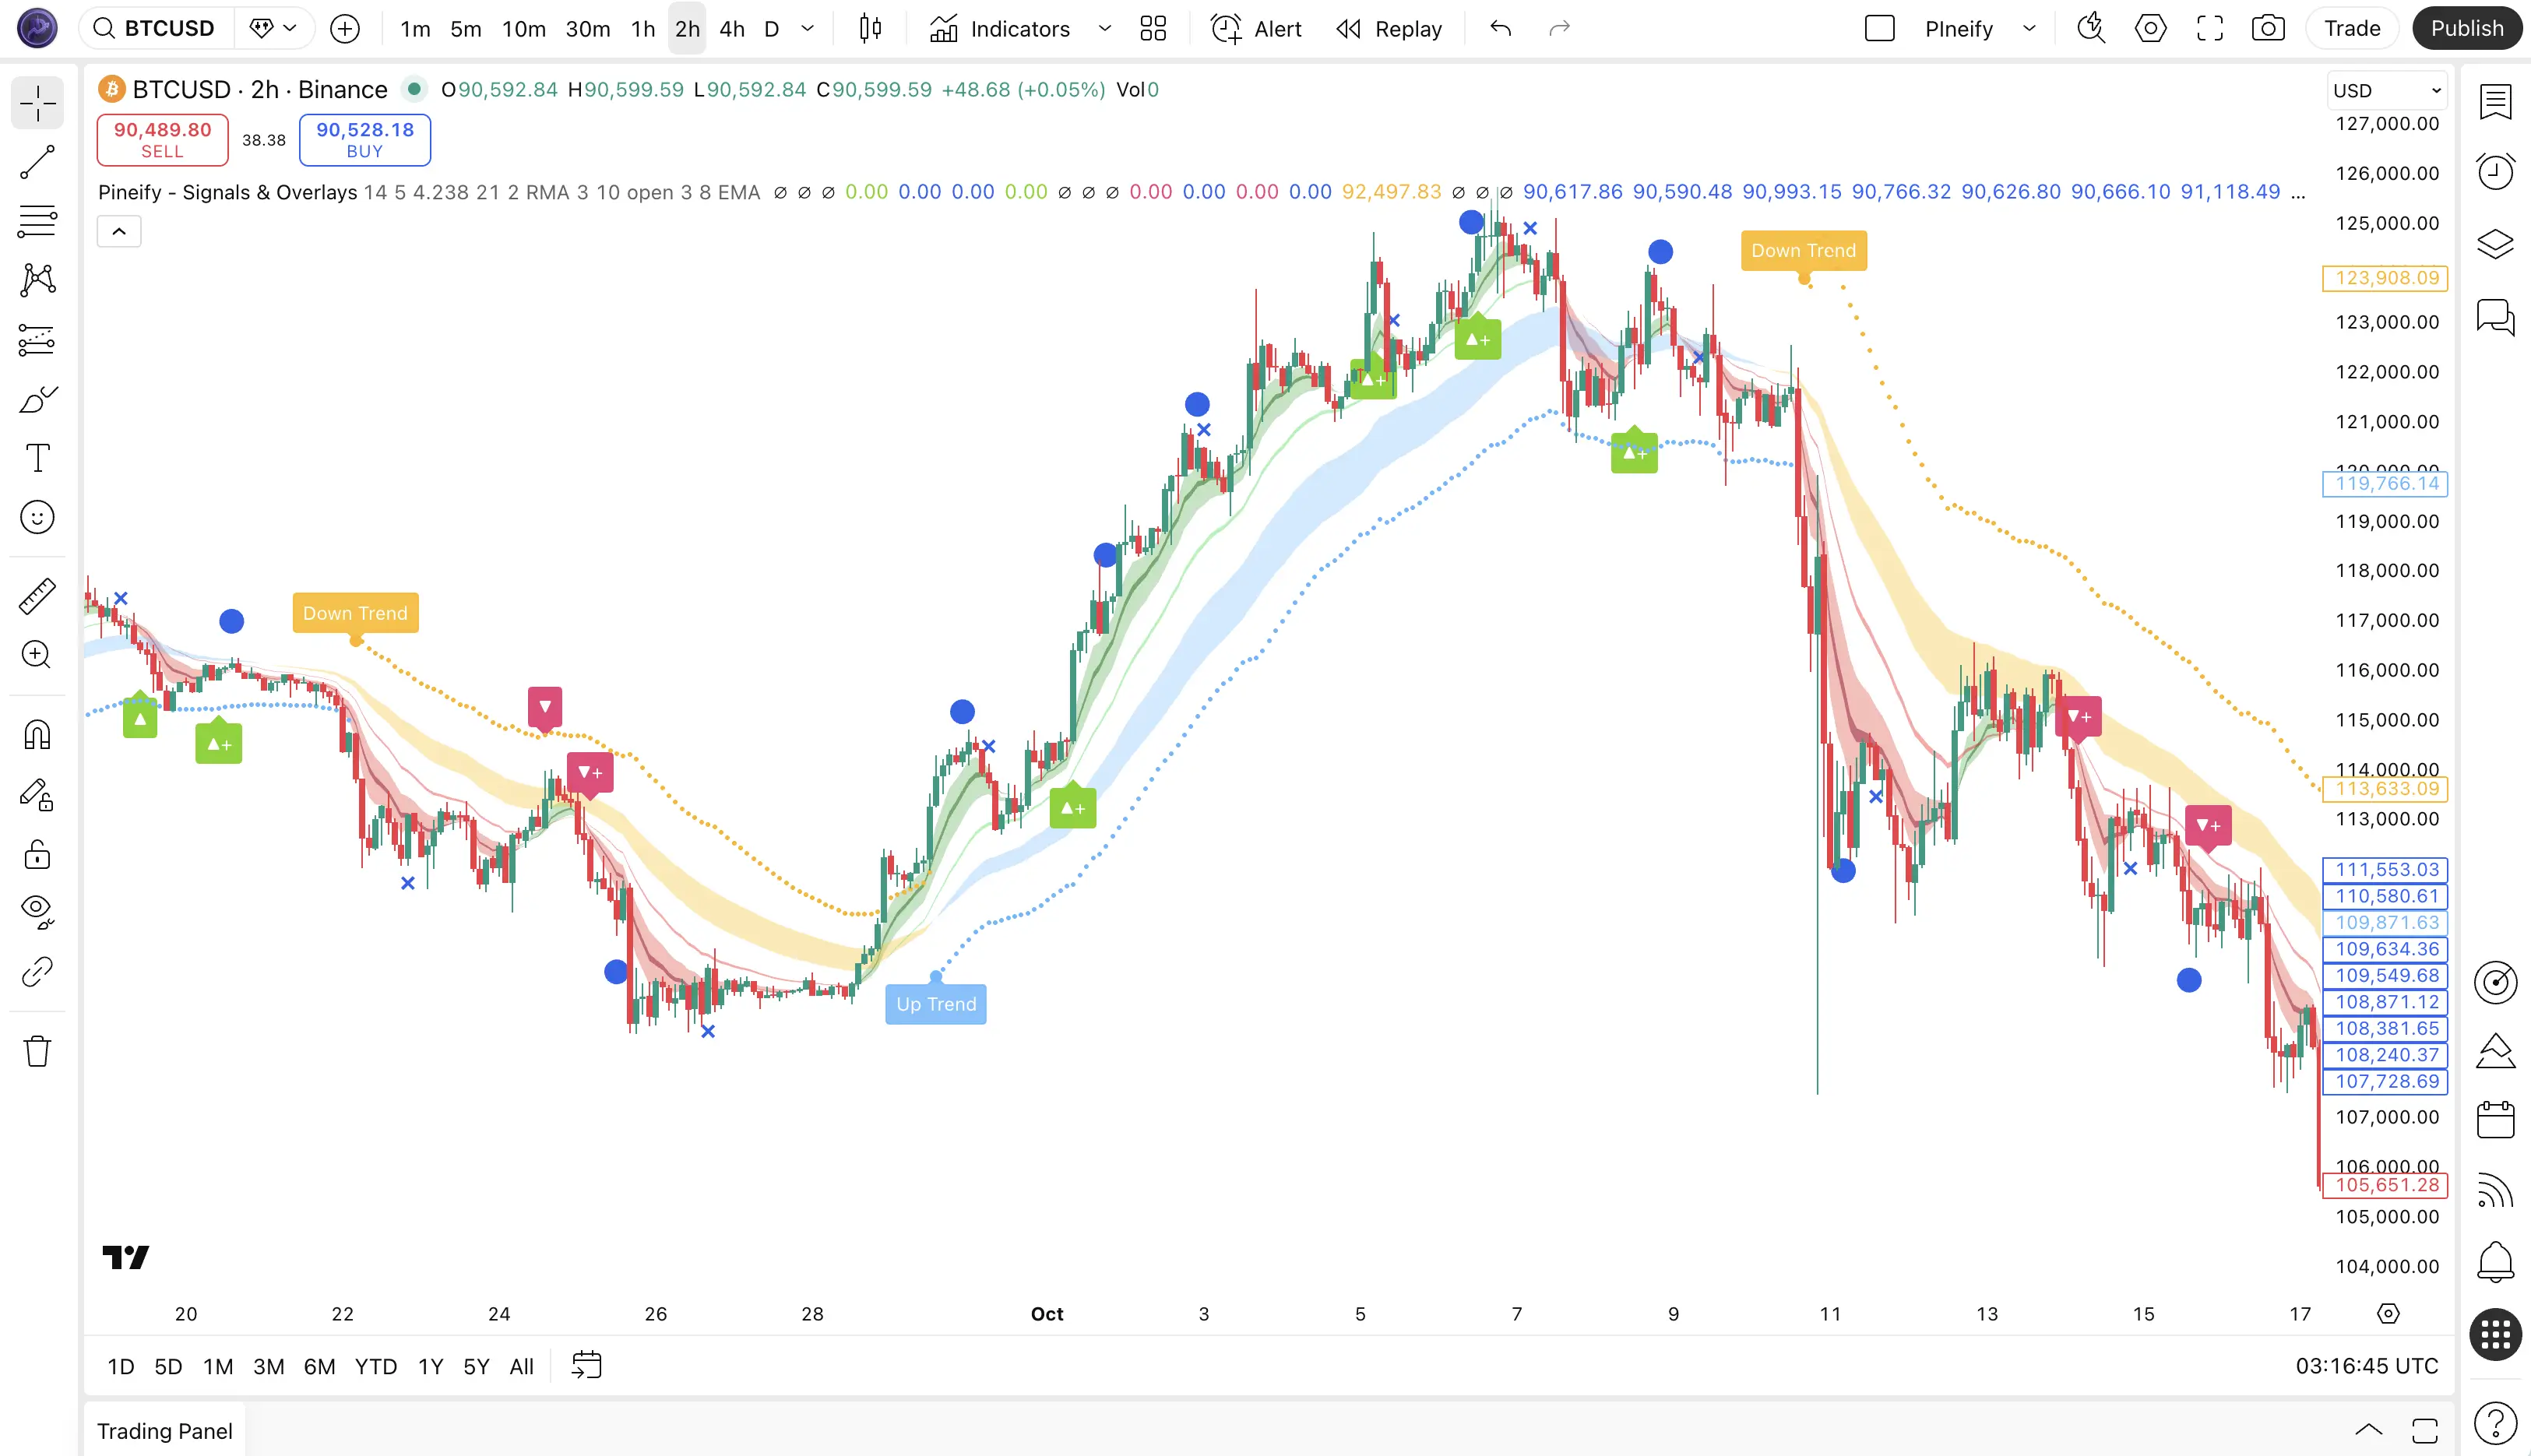
Pineify® - Signals & Overlays™: How It Works
If you're looking for a professional trading tool on TradingView, the Pineify® - Signals & Overlays™ indicator is worth understanding. It's an invite-only system that works differently from most public scripts. Instead of just showing one piece of information, it combines several proven analysis methods into a single, automatic process.
Think of it like a scoring system for each price bar. It looks at three things at once: the direction of the trend, how strong the momentum is, and the current market volatility. A trading signal only pops up when all three of these factors agree to a certain level. This agreement, or confluence, is a key principle used in professional analysis to help filter out the noise.
Based on backtesting across various markets and timeframes, the system has shown an 87% win rate. The highest single trade return recorded was 412%, and it's currently used by over 100,000 traders.
What It Offers
- Trend Cloud Visualization: A colored overlay on the chart shows the trend. Blues and greens suggest a bullish market, while yellows and reds point to bearish conditions.
- Dow Theory Integration: It identifies primary and secondary trends based on classic Dow Theory, adding a foundational layer to the signals.
- ATR-Based Risk Management: Every signal includes a suggested stop-loss line based on Average True Range (ATR), helping you decide where to place your stop objectively.
- Multi-Timeframe Filtering: To reduce false signals, it checks the trend on a higher timeframe before showing a signal on your current chart.
- Real-Time Alerts: You can set up TradingView push notifications so you get alerted to new setups, even if you're not looking at your charts.
How to Get Started in 4 Steps
- In your TradingView chart, open the Indicators menu, go to "Invite-only scripts," and choose Pineify® - Signals & Overlays™.
- Look at the Cloud color for the trend bias. Blue/green means bullish, red/yellow means bearish.
- When a signal icon appears, wait for that candle to close before entering a trade.
- Set your Stop Loss at the provided ATR Line. You can move your stop to break-even once the price moves favorably.
Pineify vs. Standard TradingView Tools: What's the Real Difference?
Many traders start with a single indicator, then move to those all-in-one toolkits. You know the type — scripts like LuxAlgo that pack 20 or more signals into one chart window. They're feature-rich, for sure. But here's the catch: you're still left staring at a screen full of arrows and colors, trying to figure out which signal is the "right" one. It puts all the pieces in front of you, but you still have to do the final, tricky puzzle assembly yourself.
Pineify works on a different principle. Think of it less as a toolbox and more as a trading partner. Instead of giving you a dozen potentially conflicting clues, it does the analysis for you. Its built-in scoring system acts like a filter, so you only see the setups where the market's story aligns across different timeframes and metrics. Conflicting signals get weeded out before they ever hit your chart.
It's the difference between getting a pile of raw data and getting a clear, summarized report. This approach is similar to how professional quant teams operate — they let the system do the heavy filtering first, so a human can review only the highest-probability opportunities. With Pineify, the hard work of synthesis is already done.
Find Your Trading Rhythm
One of the best things about Pineify is that it doesn't box you into one way of trading. Whether you're glued to the screens all day or just checking in weekly, it adapts to your pace.
-
If you're a day trader, you'll love the settings for the 1 to 15-minute charts. They're built to help pinpoint those quick entries and exits, giving you the clarity to place tight stops and manage fast-moving trades.
-
For swing traders, the real magic happens on the 4-hour and daily charts. The signals here are designed to help you catch the meat of a trend, allowing you to hold for days or even weeks to capture more significant moves.
-
Long-term investors can use it as a health check for their portfolio. By highlighting longer-cycle trends, it can help you spot major market shifts, potentially reducing drawdowns by signaling when the overall tide might be turning.
-
And it works everywhere you trade. You don't need to tweak or reconfigure it between markets. It performs consistently whether you're looking at cryptocurrencies, forex pairs, stocks, or commodities.
How to Get Access and What It Costs
The Pineify® - Signals & Overlays™ indicator isn't something you can just add to cart. It works on an invite-only basis and comes with specific Pineify membership levels. The reasoning is straightforward: if everyone had the same signals, those signals would start to lose their effectiveness. Keeping access limited helps maintain the quality and edge for everyone who uses it.
Here's a breakdown of which plans include it:
| Plan | Price (One-Time) | Includes Signals & Overlays? |
|---|---|---|
| Plus | $99 (was $129) | ❌ Not included |
| Advanced | $149 (was $219) | ✅ Yes — full indicator access + 1,000 AI credits/month |
| Expert | $259 (was $369) | ✅ Yes — plus 2,500 AI credits/month + AI Stock Picker |
The best part? Every tier is a one-time payment for lifetime access. There are no sneaky yearly renewals or subscription fees. If you're on the Advanced or Expert plan, you also get the added benefit of requesting tweaks to the indicator, so you can adjust it to fit your trading style a bit better.
If you're interested in getting an invite, you'll want to look into upgrading to either the Advanced or Expert plan. That's your ticket in.
Q&A: Common Questions About TradingView Reversal Indicators
Q: Can any indicator be 99% accurate? Honestly, no — and if someone tells you otherwise, be very skeptical. That kind of claim is usually a sign of an unrealistic system. In the real world, a solid, well-tested indicator might consistently be accurate a bit more than half the time. The real key is pairing that with smart risk management. For example, Pineify's system showed an 87% win rate in backtesting, which is a fantastic result. But even then, your actual results will depend on how you use it and what the market is doing at the time.
Q: Why does multi-timeframe analysis matter? Think of it this way: buying a quick signal on a 5-minute chart while the overall daily trend is pointing down is like trying to swim against a very strong current. You might get a few good strokes in, but it's exhausting and risky. Checking multiple timeframes helps you make sure your short-term move is actually going with the market's bigger picture, which helps you avoid a lot of bad trades.
Q: Can I use Pineify alongside other indicators? Absolutely. Pineify's system is built to analyze trend, momentum, and volatility all together. So you don't need to add other indicators that do the same thing. Instead, you can add tools that give you different information — like a volume indicator to see if other traders are backing up the signal. The goal is to complement, not duplicate. For instance, you could pair it with one of the top pullback indicators for TradingView to fine-tune your entry points.
Q: What is confluence, and why does it matter? Confluence is just a fancy word for getting multiple, separate pieces of evidence to agree. Imagine if you had a sore knee and one doctor suggested a treatment. If two more independent doctors looked at it and all agreed on the same solution, you'd feel a lot more confident, right? It's the same with trading. When different types of analysis (like price action, momentum, and support/resistance) all point to the same setup, that signal is statistically much stronger.
Q: How long before I see consistent results? The signals will show up right away, but getting consistent with your results takes practice. Don't jump in with real money immediately. Start by paper trading to get a feel for it. Keep a simple journal: write down each signal, why you took it, and what happened. This real data is what you'll use to fine-tune your own rules for entering and exiting trades. Once your journal shows you're on the right track, then you can think about scaling up. A dedicated tool like our free trading journal can simplify this process.
Testing the System on Your Charts
The real test of any trading tool is seeing how it works with your own strategy and charts. Here's how to test Pineify - Signals & Overlays:
- Check out the details first. Head to pineify.app/invite-only-indicator to see the current access options and pricing. This gives you a clear starting point.
- Take it for a test drive with paper trading. Before using real money, run the signals on your favorite market in a practice account. Get a feel for how it aligns with what you're seeing on the chart.
- Keep a simple trading journal. For each signal you test, jot down the type of signal, what the market was doing at the time, your timeframe, and the outcome. You'll start to notice what works best for your approach.
- Connect with other traders. The Pineify Discord community is active and full of people using the tool. It's a great place to ask questions and see how others are applying it.
- Never skip your risk rules. Decide beforehand how much you're willing to risk on a trade, your max exposure, and what conditions will keep you on the sidelines. Let the signals inform your decisions, not replace your discipline.
No tool can think for you. Pineify - Signals & Overlays is designed to take the heavy lifting out of chart analysis, giving you a clear, professional-grade view. The rest — the judgment and risk management — stays firmly in your hands.
Frequently Asked Questions
▶What makes a trading signal institutional-grade?
An institutional-grade signal requires confluence across multiple independent factors — trend direction, momentum strength, and volume or volatility confirmation — before triggering. Rather than acting on a single indicator flash, professional systems wait until all factors agree, dramatically reducing false positives and improving the quality of each setup.
▶How does multi-timeframe filtering reduce false signals?
Multi-timeframe filtering checks whether the higher-timeframe trend aligns with the signal on your current chart. A bullish signal on a 15-minute chart is far weaker if the daily chart is in a downtrend. By requiring agreement across timeframes, the system filters out trades that go against the dominant market flow.
▶What is ATR-based risk management and why does it matter?
ATR (Average True Range) measures how much an asset typically moves in a given period. Using ATR to set stop-losses means your risk adapts to current market volatility — wider stops in choppy conditions, tighter stops in calm markets. This prevents getting stopped out by normal noise while still protecting against genuine reversals.
▶How does Dow Theory improve reversal detection?
Dow Theory identifies primary and secondary trends through the sequence of higher highs/higher lows (uptrend) or lower highs/lower lows (downtrend). Adding this layer to signal generation means a reversal alert is only generated when price structure confirms a genuine trend change, not just a short-term price spike.
▶Can confluence-based systems work across different asset classes?
Yes. The core principles of trend, momentum, and volatility confluence apply equally to stocks, forex pairs, cryptocurrencies, and commodities. Because the analysis is based on price structure and volume dynamics rather than asset-specific rules, a well-designed confluence system adapts across markets without requiring separate configurations.
▶How many confirmations are typically needed for a high-probability reversal signal?
Most professional systems require at least three independent confirmations: a trend filter (e.g., moving average or Dow Theory), a momentum indicator (e.g., RSI or MACD), and a volume or volatility trigger. When all three align at a key support or resistance level, the probability of a genuine reversal increases significantly compared to relying on any single indicator.