Smart Money Concepts Trading with Pineify Signals & Overlays
Hedge funds and institutions don't guess where price is headed. They place large orders at specific levels, and those levels leave tracks anyone can learn to read. Smart Money Concepts (SMC) is a framework for reading those tracks—spotting where the big players are buying or selling based on how price behaves, not by relying on slow indicators.
The idea is simple: instead of asking what a moving average says, you ask where real money changed hands. SMC focuses on a few concrete patterns:
- Order Blocks: Narrow price zones where a surge of buying or selling actually took place. Think of them as footprints showing you where institutions stepped in.
- Liquidity Zones: Areas around obvious levels—recent highs, lows, round numbers—where stop orders pile up. Big moves often sweep through these to grab liquidity before reversing.
- Break of Structure (BOS) / Change of Character (CHoCH): BOS confirms an active trend is continuing. CHoCH signals the trend might be shifting direction.
- Fair Value Gaps (FVG): Small gaps in price where trading jumped past an area quickly. The market often revisits these to fill the imbalance.
- Inducement & Stop Hunts: Sharp counter-moves designed to trigger retail stop-losses, letting institutions enter at better prices.
The advantage of this approach is that it's anchored to real activity—actual orders and price movement—not abstract lines. An order block isn't a guess; it's a zone where something already happened. I've found this makes a real difference when I'm scanning for setups on charts like BTCUSD or EURUSD. For momentum confirmation alongside SMC, the Percentage Price Oscillator (PPO) Trading Strategy pairs well with order block analysis.
Why Manual SMC Analysis Falls Short
Smart Money Concepts gives you a useful lens, but if you've tried running this analysis manually, you've hit some real obstacles.
Seeing what you want to see. The biggest problem is subjectivity. What looks like a clean order block to you might look like noise to the next trader. Two people can draw completely different zones on the same chart, and neither one is wrong. That ambiguity eats into confidence when you're about to enter a trade.
Too many tools, no single answer. It's tempting to stack indicators: one for order blocks, another for BOS, a separate one for FVG. But when they disagree at a critical moment, you're stuck guessing. I ran into this constantly before switching to a unified system. It's like having three alarm clocks set to different times.
No cross-timeframe check. Most SMC tools show you one timeframe in isolation. You have to manually pull up the daily, the 4H, the 1H, and try to reconcile them. That's a lot of tabs and a lot of mental overhead.
*You end up interpreting more than you trade. *
The fix isn't more indicators. It's a system that applies the logic consistently across timeframes and conditions. A tool that translates your SMC logic into clean TradingView code without manual scripting can be a real time-saver. For anyone new to the language, TradingView Script Examples: Essential Guide for Traders is worth bookmarking.

What Pineify's Confluence System Does Differently
Pineify – Signals & Overlays doesn't just throw another indicator on your chart. It's a confluence-based signal system: a signal fires only when multiple independent factors—trend direction, momentum strength, volatility—agree at the same time.
This mirrors how institutional trading desks operate. They don't act on single signals; they run everything through a filter. Pineify brings that same logic to TradingView.
How it works under the hood. The system applies Dow Theory principles to identify the primary trend and secondary moves, then layers in volatility via ATR. It's not a black box. It's a fast, consistent application of methods that work.
Multi-timeframe filtering is the killer feature. Before Pineify flashes a signal on your 15-minute chart, it checks the higher timeframe trend—say, the daily. This alone filters out most false signals. I've watched it skip buy signals on BTCUSD during a daily downtrend that I would have taken manually and regretted.
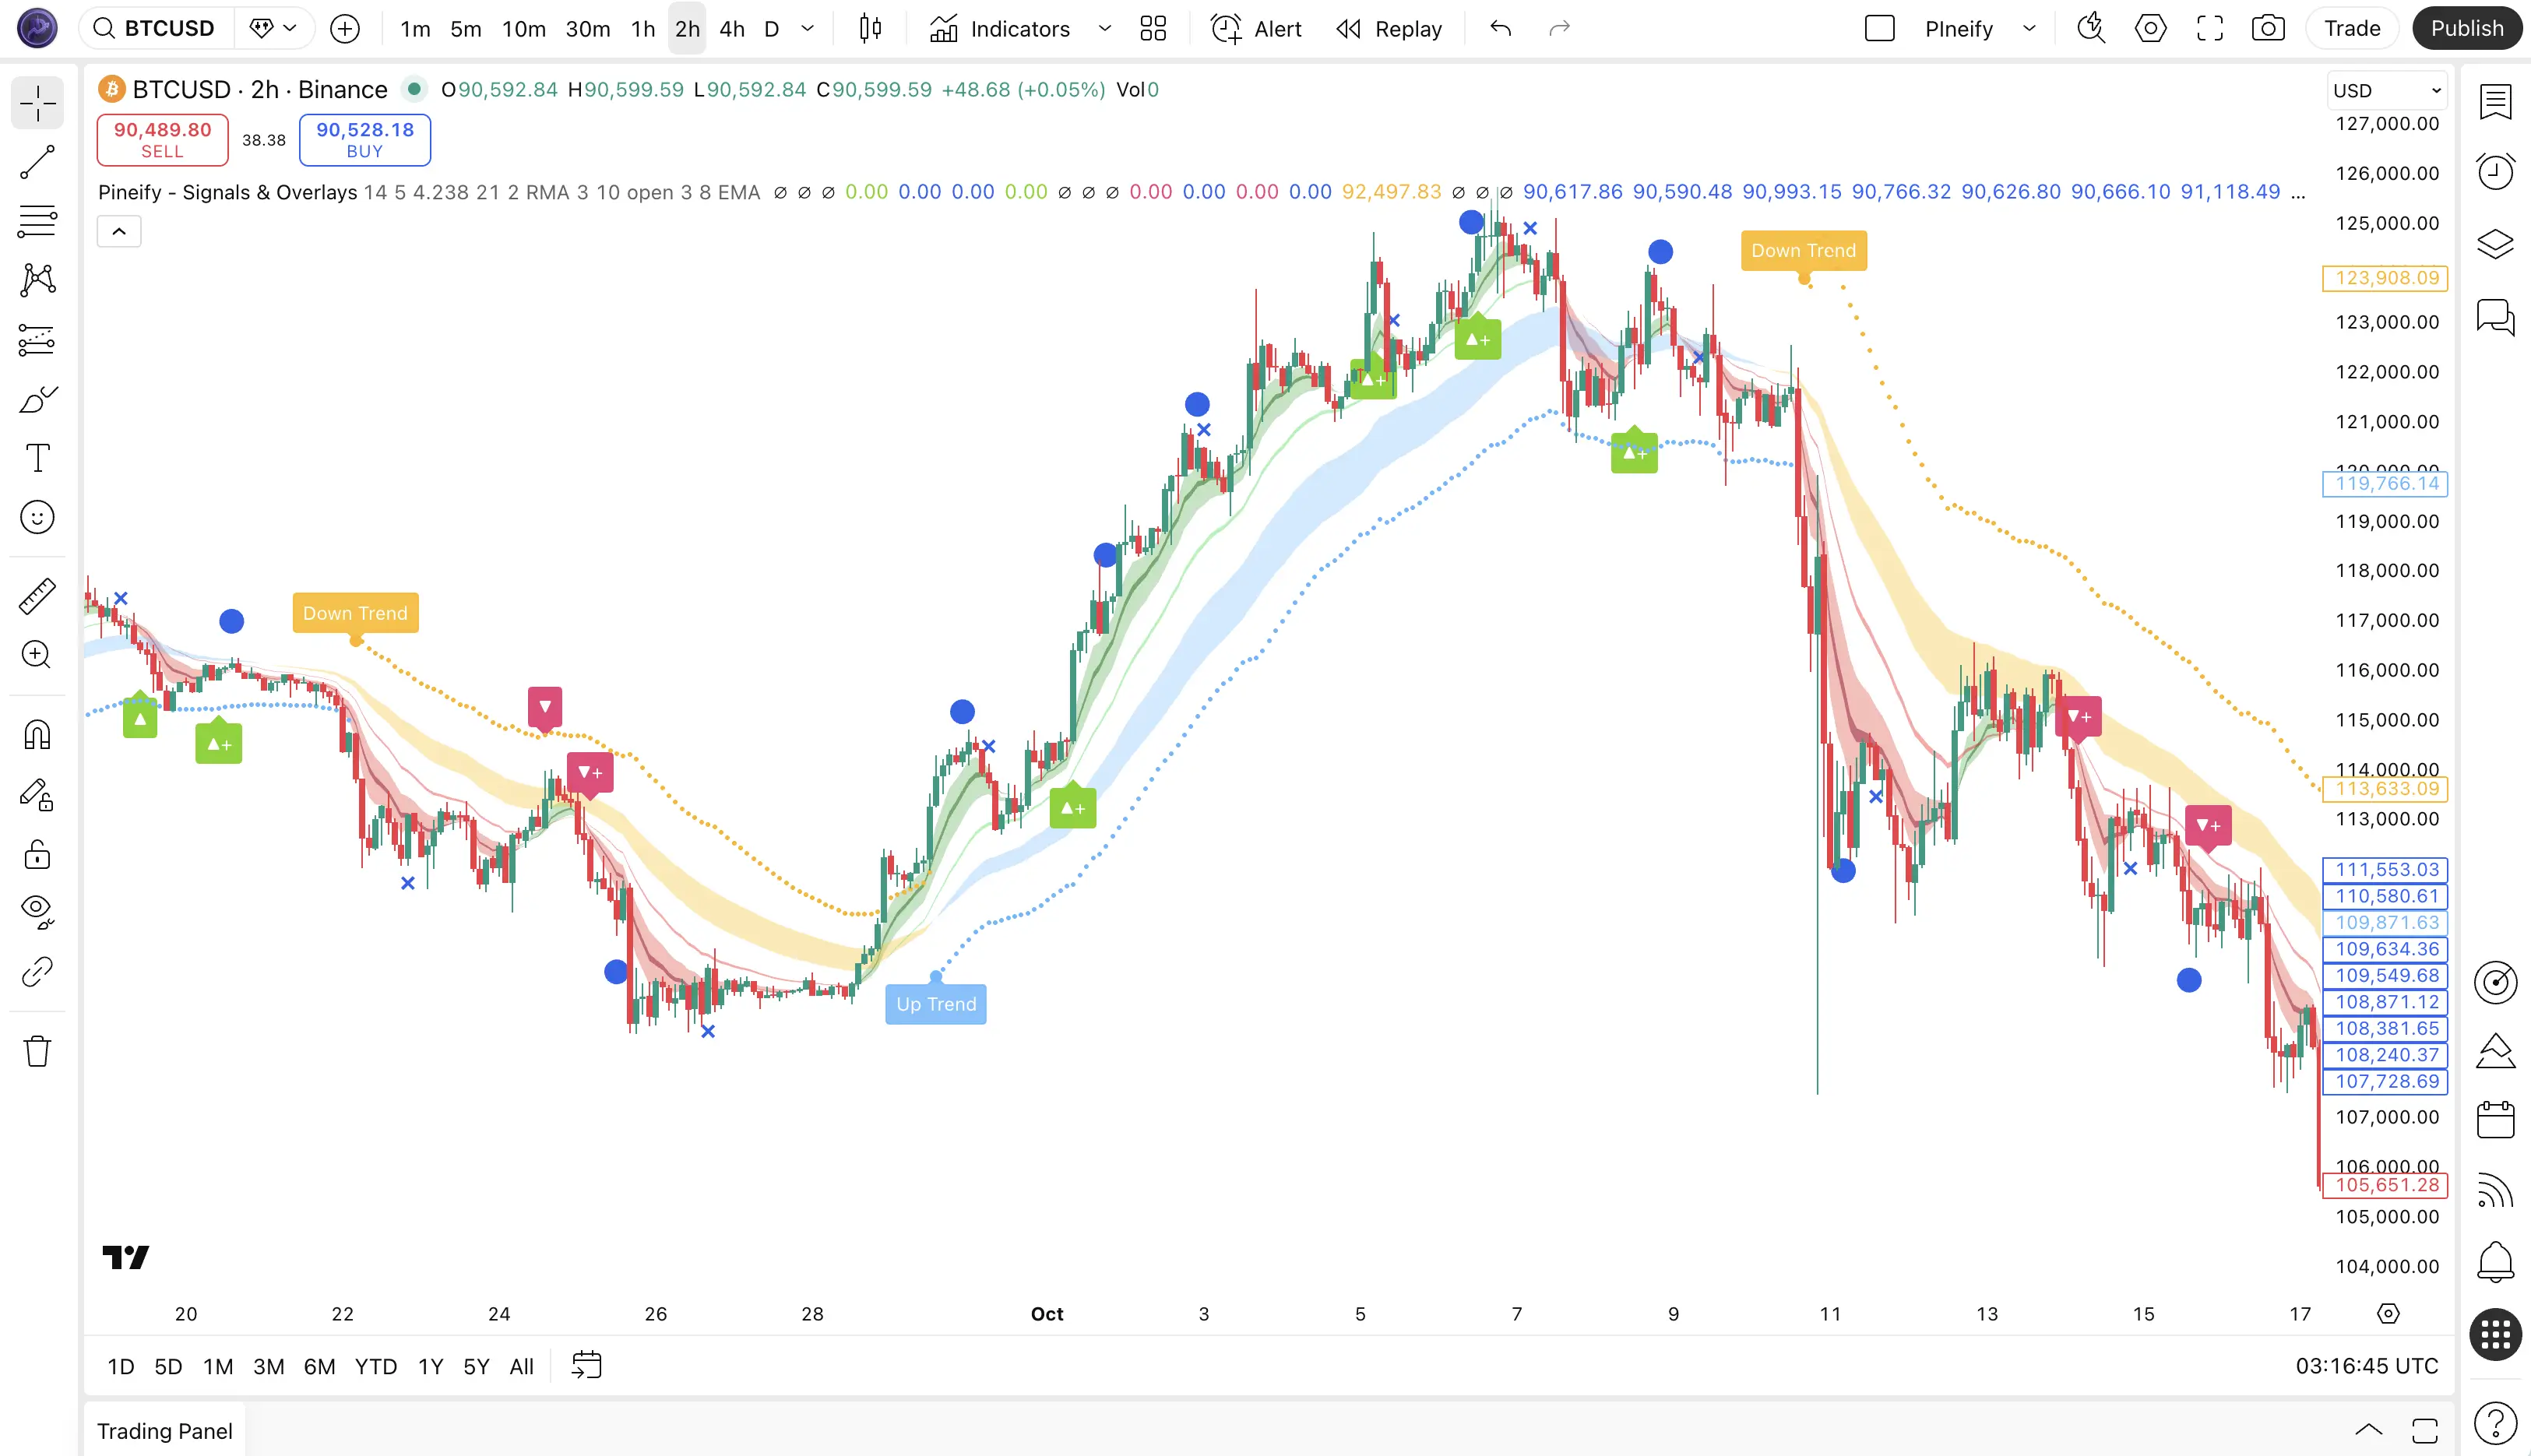
Clean charts, not cluttered ones. Instead of drawing 50 boxes and arrows, Pineify uses:
- Cloud color for trend bias: blue/green for bullish, red/yellow for bearish.
- Signal icons (▲ for LONG, ▼ for SHORT) at confluence points.
- ATR Stop Line for a dynamic, volatility-adjusted stop-loss on your chart.
Pineify vs. Traditional SMC Indicators
I've used both approaches, and here's the honest difference:
| Feature | Traditional SMC Indicators | Pineify® Signals & Overlays™ |
|---|---|---|
| Signal Basis | Single-concept (OB, BOS, FVG) | Multi-factor confluence scoring |
| Subjectivity | High — zone drawing is manual | Low — algorithmic detection |
| Multi-Timeframe | Requires separate tools | Built-in automatic HTF filter |
| Risk Management | Manual stop-loss placement | Integrated ATR Stop Line |
| Alert System | Indicator-specific, fragmented | Unified real-time alert system |
| Learning Curve | Steep — requires SMC mastery | Gentle — visual cues guide decisions |
| Asset Coverage | Primarily forex and crypto | Stocks, forex, crypto, commodities |
Traditional tools give you pieces of the puzzle, and you spend your time fitting them together. Pineify gives you the full picture at once. I won't claim it's perfect—I've had false signals in low-volatility conditions on ES futures, for example—but the hit rate is noticeably better than anything I pieced together manually.
I haven't tested it on penny stocks or ultra-low-liquidity pairs, so I can't vouch for those markets. For the major forex pairs and crypto I trade regularly, it's been solid. I prefer using the daily chart for the macro trend filter and the 15-minute for entries—that combination gives me the cleanest signals. Getting comfortable with TradingView itself is half the battle, and How to Use TradingView for Beginners helped me set up my workspace properly.
Applying Pineify Alongside SMC Concepts
Here's a workflow I've settled on after a few weeks of trading with this system. It combines manual SMC analysis with Pineify's signals.
Step 1 — Identify the macro trend. Start on the daily or 4H chart. Check the Pineify cloud color. Green suggests institutions are accumulating; red suggests distribution. This tells you what side of the market to favor.
Step 2 — Mark the key levels. On your trading timeframe, draw your SMC zones:
- Order blocks where strong moves originated.
- Liquidity pools above highs and below lows.
- Fair value gaps where price jumped.
Step 3 — Wait for confluence. Don't enter just because price hits a level. Wait for Pineify's arrow signal (▲/▼) at or near that zone. When your manual analysis and the system agree, the probability shifts in your favor.
Step 4 — Set your stop. Use the ATR Stop Line as your initial stop. If the trade works, move to break-even. I ran this on a EURUSD trade on June 2, and the ATR stop was 14 pips wider than my manual guess would have been—which saved me from getting stopped out prematurely.
Who Benefits Most
Pineify fits different styles, but here's who I think gets the most value:
- Day traders working 1-15 minute charts get clearer entry points throughout the session.
- Swing traders on 4H or daily charts stay aligned with the main trend without second-guessing.
- Long-term investors can use the cloud overlay to spot major structural shifts, like when the daily cloud flips from green to red.
- Beginners skip the indicator overload trap and learn to read price action with visual guides.
If you already understand order blocks and liquidity, Pineify saves you the manual cross-timeframe checking. Had a setup on NVDA last week where my manual analysis said buy, but Pineify's higher-timeframe filter held me out. Price dropped 4% the next day. Sometimes the signal you don't take is the most valuable one.
Pricing and Access
Access to Signals & Overlays runs through an invite-only system. This isn't about exclusivity for its own sake—it prevents signal overcrowding, which can degrade performance over time.
All plans are one-time lifetime payments, no subscriptions:
| Plan | Price (Discounted) | Signals & Overlays Included |
|---|---|---|
| Plus | $99 (reg. $129) | Not included |
| Advanced | $149 (reg. $219) | Full access |
| Expert | $259 (reg. $369) | Full access + AI tools |
The Advanced plan gets you started with the indicator plus 1,000 monthly AI credits, a Strategy Optimizer, a Trading Journal, and Backtest Reports. Over 100,000 traders are on the platform now. The 87% win rate comes from automated backtesting across multiple markets—your live results will vary based on your market and discipline. For more on how the invite-only model works, How to Get Invite-Only Scripts on TradingView breaks down the process.
Frequently Asked Questions
▶Can Pineify replace Smart Money Concepts entirely?
Not really—and that's fine. SMC helps you locate where price is likely to react. Pineify helps you time your entries within those zones. They work as a pair, not a replacement.
▶Does Pineify's SMC indicator work on crypto and forex, not just stocks?
Yes. I've used it on BTCUSD, EURUSD, and several commodities. It works on any TradingView chart across all timeframes.
▶What makes the 87% win rate credible?
It's based on automated backtesting across many markets and periods. The system filters out weak setups by requiring multiple conditions to align before showing a signal. In live trading, your results depend on your own discipline and market conditions.
▶Is this suitable if I'm new to Smart Money Concepts?
I think it's a good starting point. Instead of drowning in theory, you see what an institutional-grade setup looks like in real time. You learn by watching the signals and understanding why they appear.
▶How does the invite-only structure benefit users?
Two things. It protects the signal's edge—overused signals lose their effectiveness. And it means members get faster support, early feature access, and custom request options on higher tiers.
▶What is a Fair Value Gap (FVG) in Smart Money Concepts?
An FVG is a price area where the market moved so quickly that little trading happened, leaving an imbalance. Price tends to revisit these gaps later. Pineify marks them automatically so you don't have to scan every candle.
▶How does multi-timeframe SMC analysis improve trade accuracy?
It confirms that your trading timeframe signal aligns with the higher timeframe trend. A buy on the 15-minute chart is much more reliable when the daily chart is also bullish. Pineify's filter does this check automatically.
You don't need to piece together five different indicators to trade with SMC logic. Smart Money Concepts gives you the map; Pineify shows you the route. If you want to see how it fits your workflow, the first step is choosing a plan that includes Signals & Overlays.
| Step | Action | Why It Helps |
|---|---|---|
| 1 | Visit pineify.app/invite-only-indicator to see the plans. | Pick the right tier and lock in lifetime access. |
| 2 | Add the indicator to TradingView from the "Invite-only scripts" tab. | Fits right into your existing chart setup. |
| 3 | Paper trade for 2–4 weeks. Log each signal against your manual zones. | Build confidence without risking capital. |
| 4 | Join the Pineify Discord community. 100,000+ traders are in there. | See real trades and get direct feedback. |
| 5 | Review your backtest reports inside the platform. | Tweak settings for your preferred markets. |
Whether you've been trading SMC for years or you're just starting, the combination of manual zone analysis and automated confluence checking gives you a process that actually works. I wish I'd found this approach sooner—especially for the weekly screening grind.