Danelfin Alternative: Top AI-Powered Stock Analysis Platforms Compared
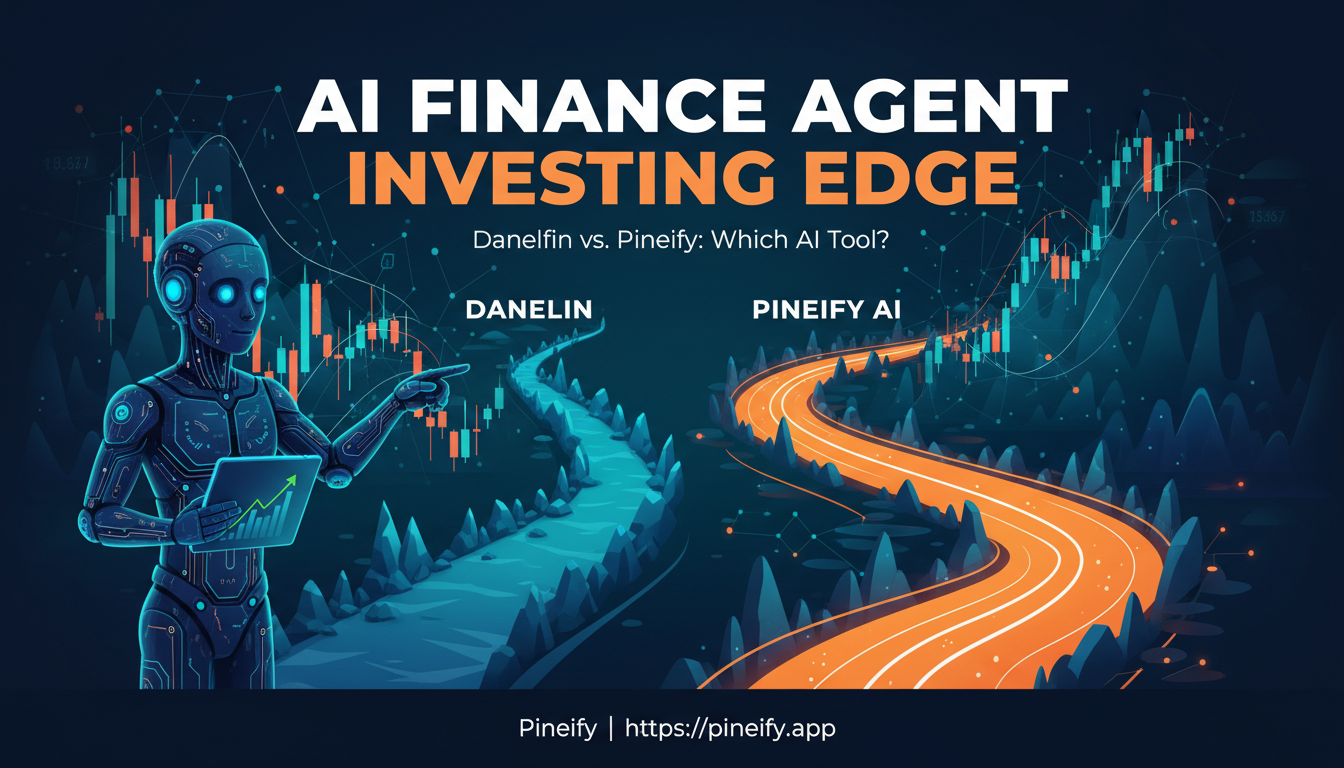
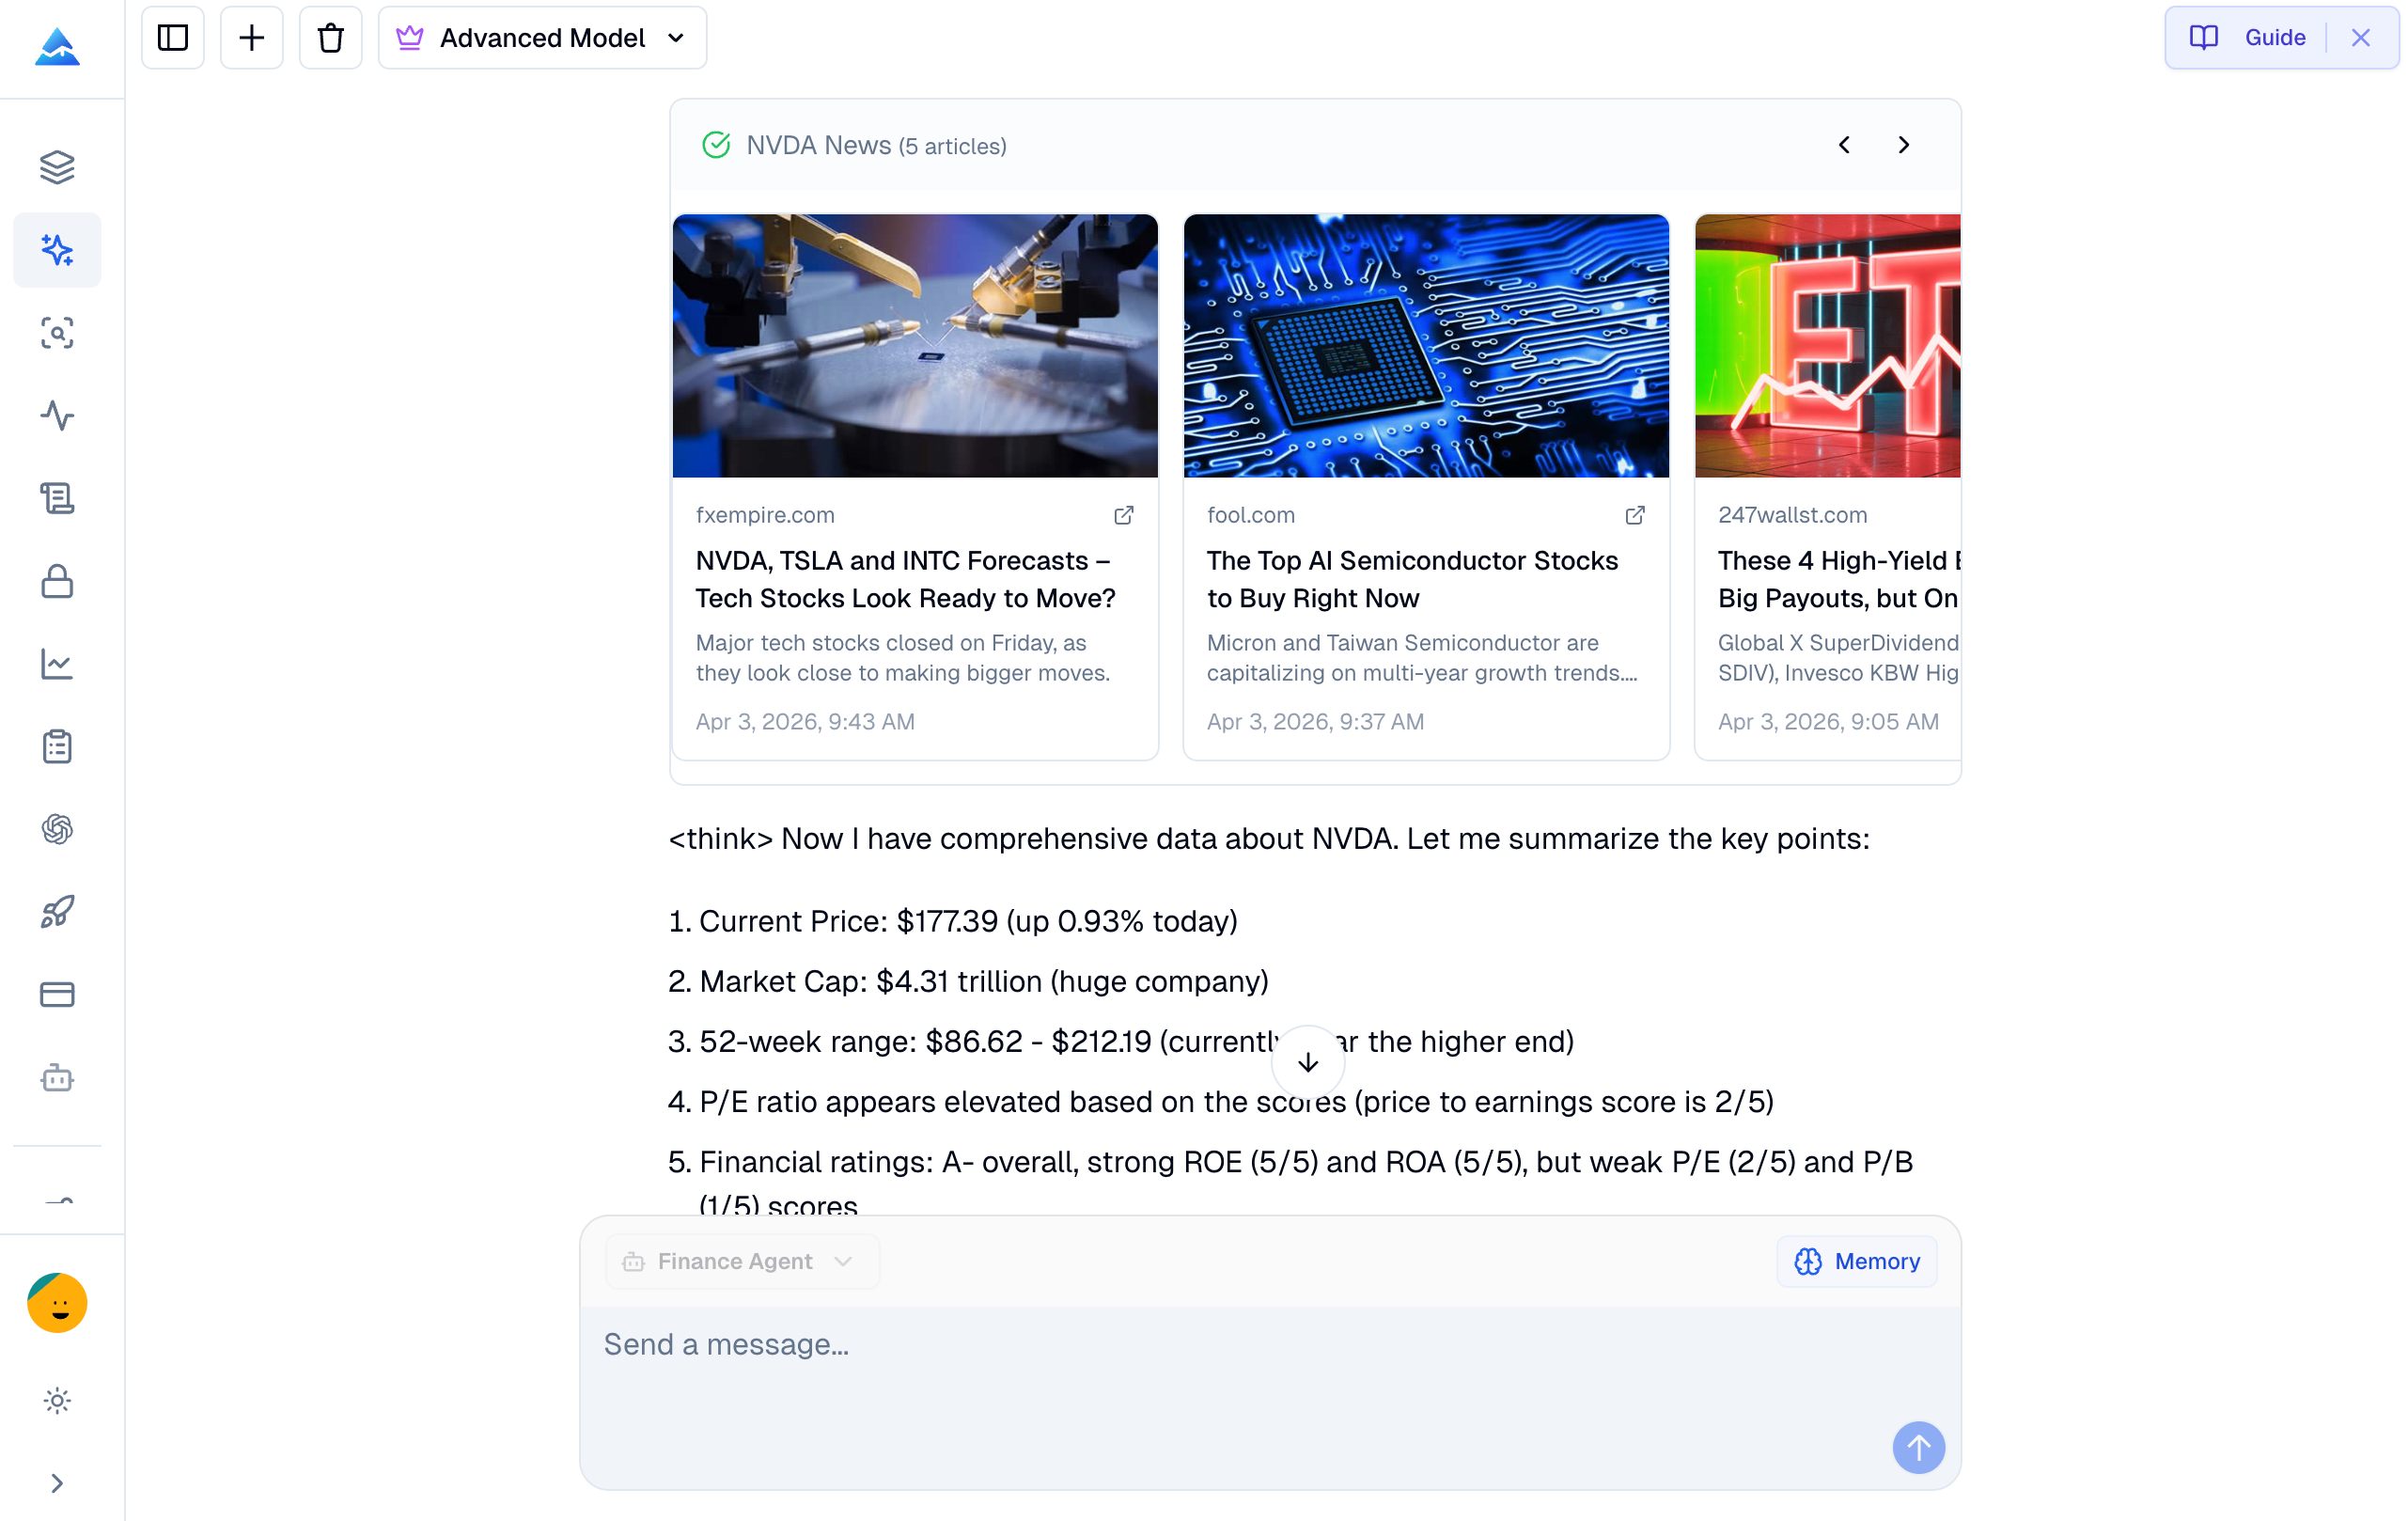
I've tested nearly a dozen AI stock analysis platforms over the past year, and one thing is clear: Danelfin isn't the right fit for most investors. Don't get me wrong—its 1-to-10 AI score is clean and useful. But after running Danelfin against Stock Rover, GuruFocus, and others on my holdings like AAPL, MSFT, and NVDA, I've found that cheaper or more specialized tools often deliver more for less.
Danelfin is an AI-powered stock analysis platform that assigns daily 1-to-10 scores to stocks based on fundamentals, technicals, and market sentiment. For traders who already rely on charting platforms, understanding your plan's features helps you allocate budget wisely between analysis tools and charting software—our TradingView Free vs Paid comparison covers the trade-offs.