Best Browser for TradingView: Which One Actually Performs Best
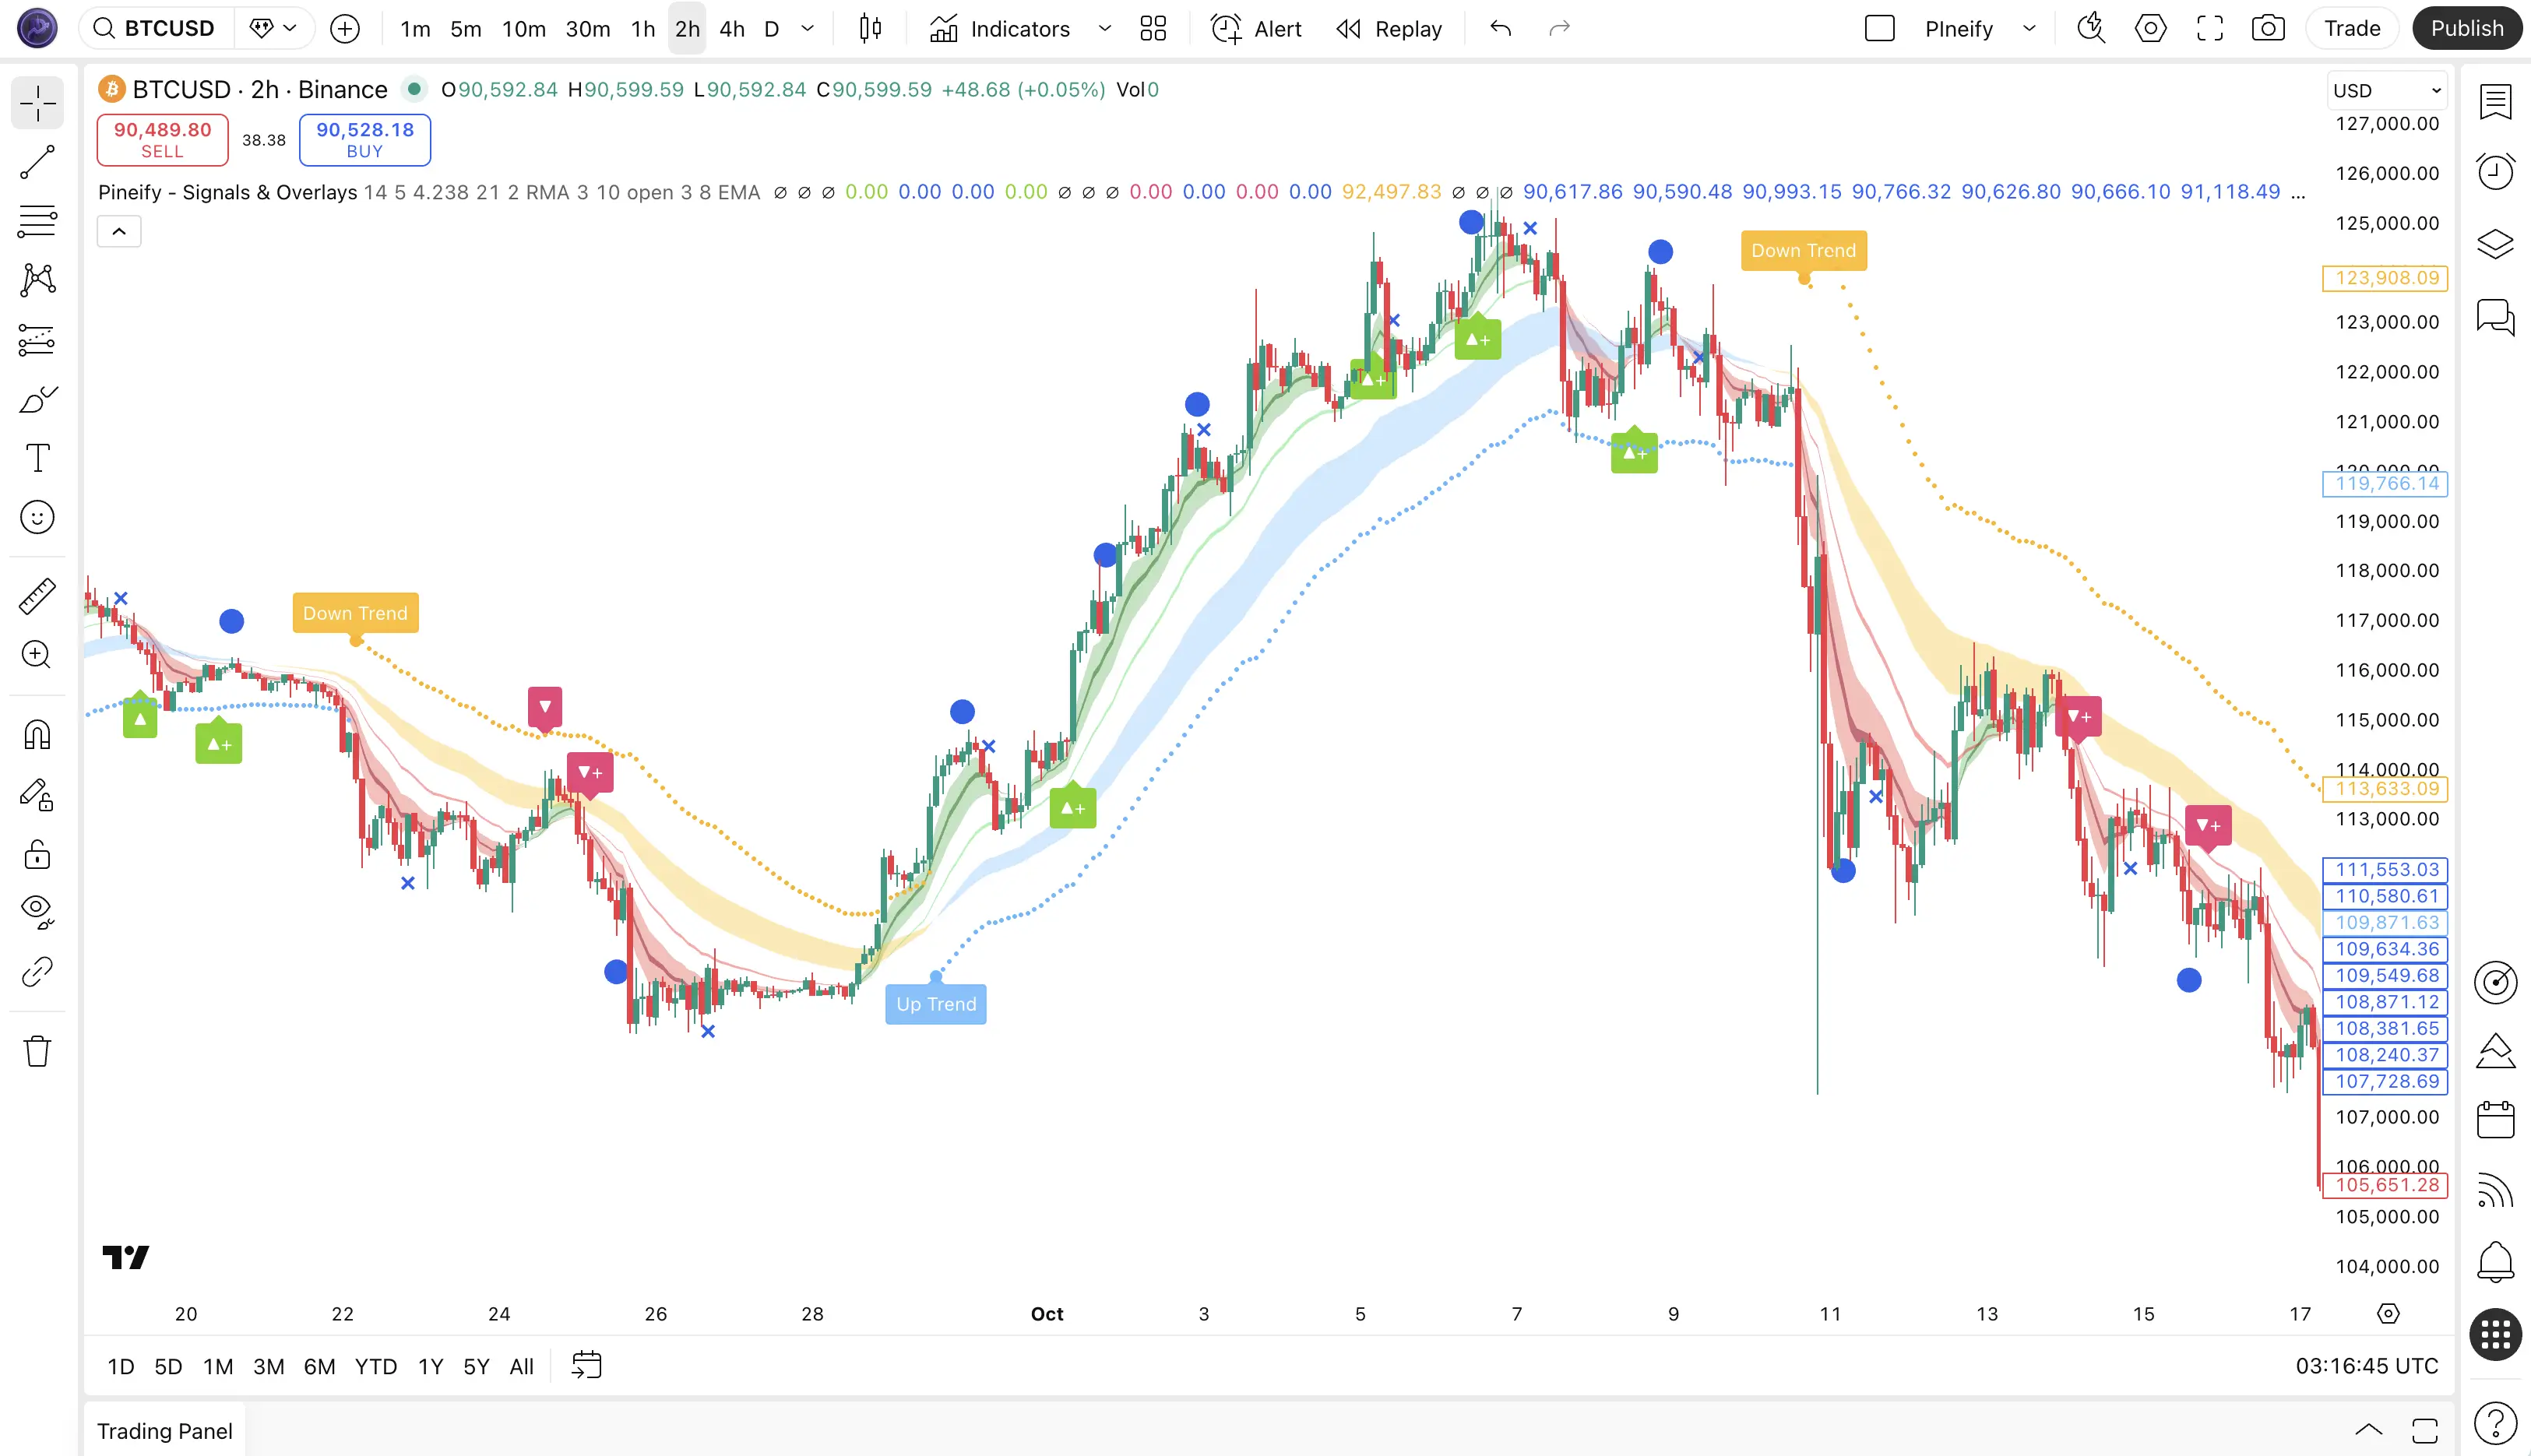
I've spent years running 15+ charts of AAPL, NVDA, and SPY simultaneously, and the browser you choose changes everything. Here's my verdict: Chrome is the most reliable pick for most traders, but the TradingView desktop app outperforms every browser for raw speed. A TradingView browser is the software interface that renders real-time price charts, executes Pine Script indicators, and streams market data through WebSocket connections.
Switching from Safari to Chrome in early 2023 cut my chart load times by roughly 40%. That difference matters when volatility spikes and every second counts. Your browser choice affects how fast candles update, whether indicators redraw smoothly, and how stable the platform stays during busy sessions.
Three things determine how well TradingView runs in your browser:
- Speed and responsiveness — crucial for real-time price updates and order execution without lag
- Stability — the last thing you need is a crash mid-session
- Resource management — some browsers handle TradingView's heavy graphics and real-time data better than others
A modern browser with WebGL support is essential for smooth, interactive charts. Getting this right is a simple step toward a better trading experience. For instance, knowing how to efficiently change time intervals on your charts can also improve your workflow.