565 posts tagged with "TradingView"

Blog posts related to the TradingView

View All Tags

Pineify vs TradingView Pine Script Editor: Pick Your No-Code Tool

· 13 min read
Pineify Team
Pine Script and AI trading workflow research team

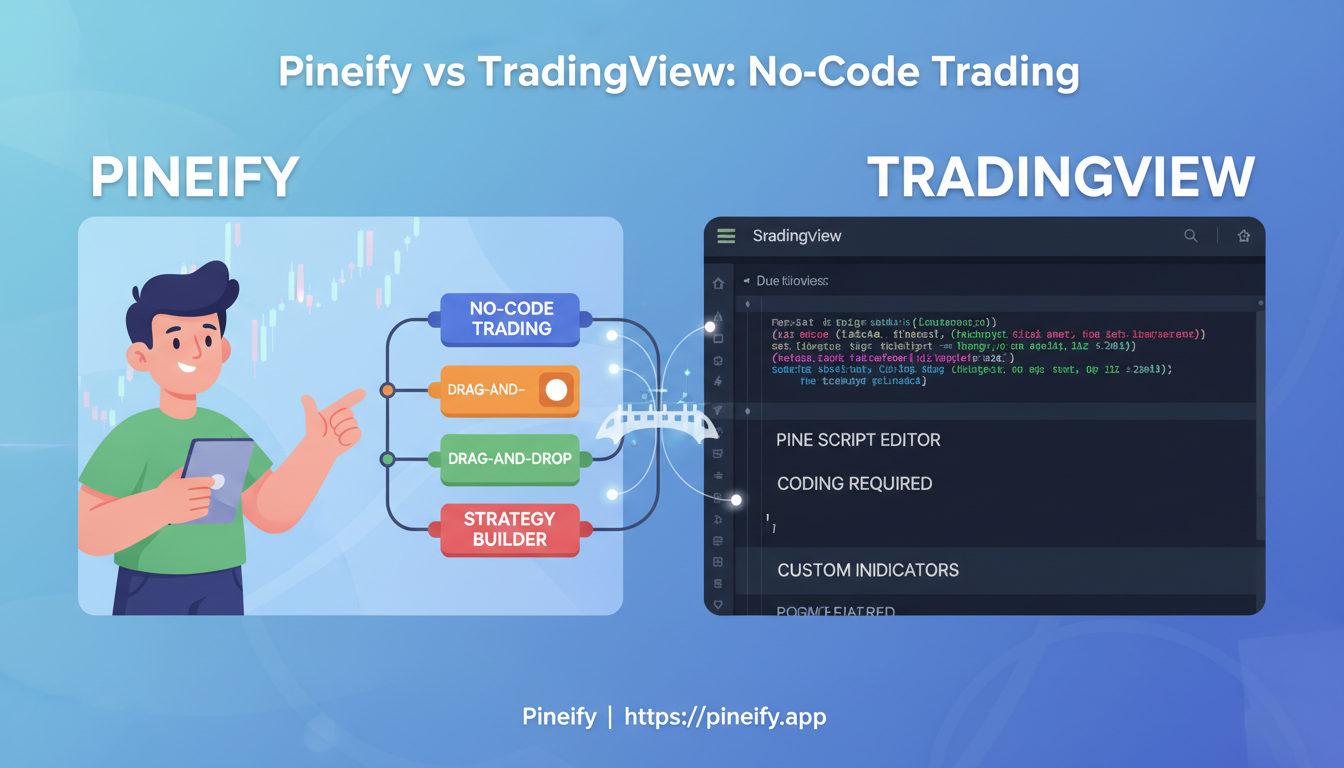
I've been building TradingView indicators for about two years, and I've used both TradingView's Pine Script Editor and Pineify across dozens of strategies. Here's my verdict up front: if you already write Pine Script, stick with the built-in editor — it's free, fast, and deeply integrated. If you don't code, or you want to build indicators faster without syntax errors, Pineify is the better pick. TradingView's Pine Script Editor is the platform's native coding environment where you write indicators and strategies using Pine Script. Pineify is a browser-based visual tool that generates clean Pine Script v5 and v6 code from drag-and-drop blocks. I used the Pine Editor almost exclusively for my first six months, and I can tell you the learning curve is steeper than most tutorials admit. Last month I built a multi-timeframe RSI screener for AAPL and TSLA in Pineify in about 15 minutes — doing that in raw Pine Script would have eaten my whole afternoon.


Pineify vs TradingView Pine Script Editor: Choose Your No-Code Trading Tool

Pineify Invite-Only vs TrendSpider: TradingView Comparison

· 19 min read
Pineify Team
Pine Script and AI trading workflow research team

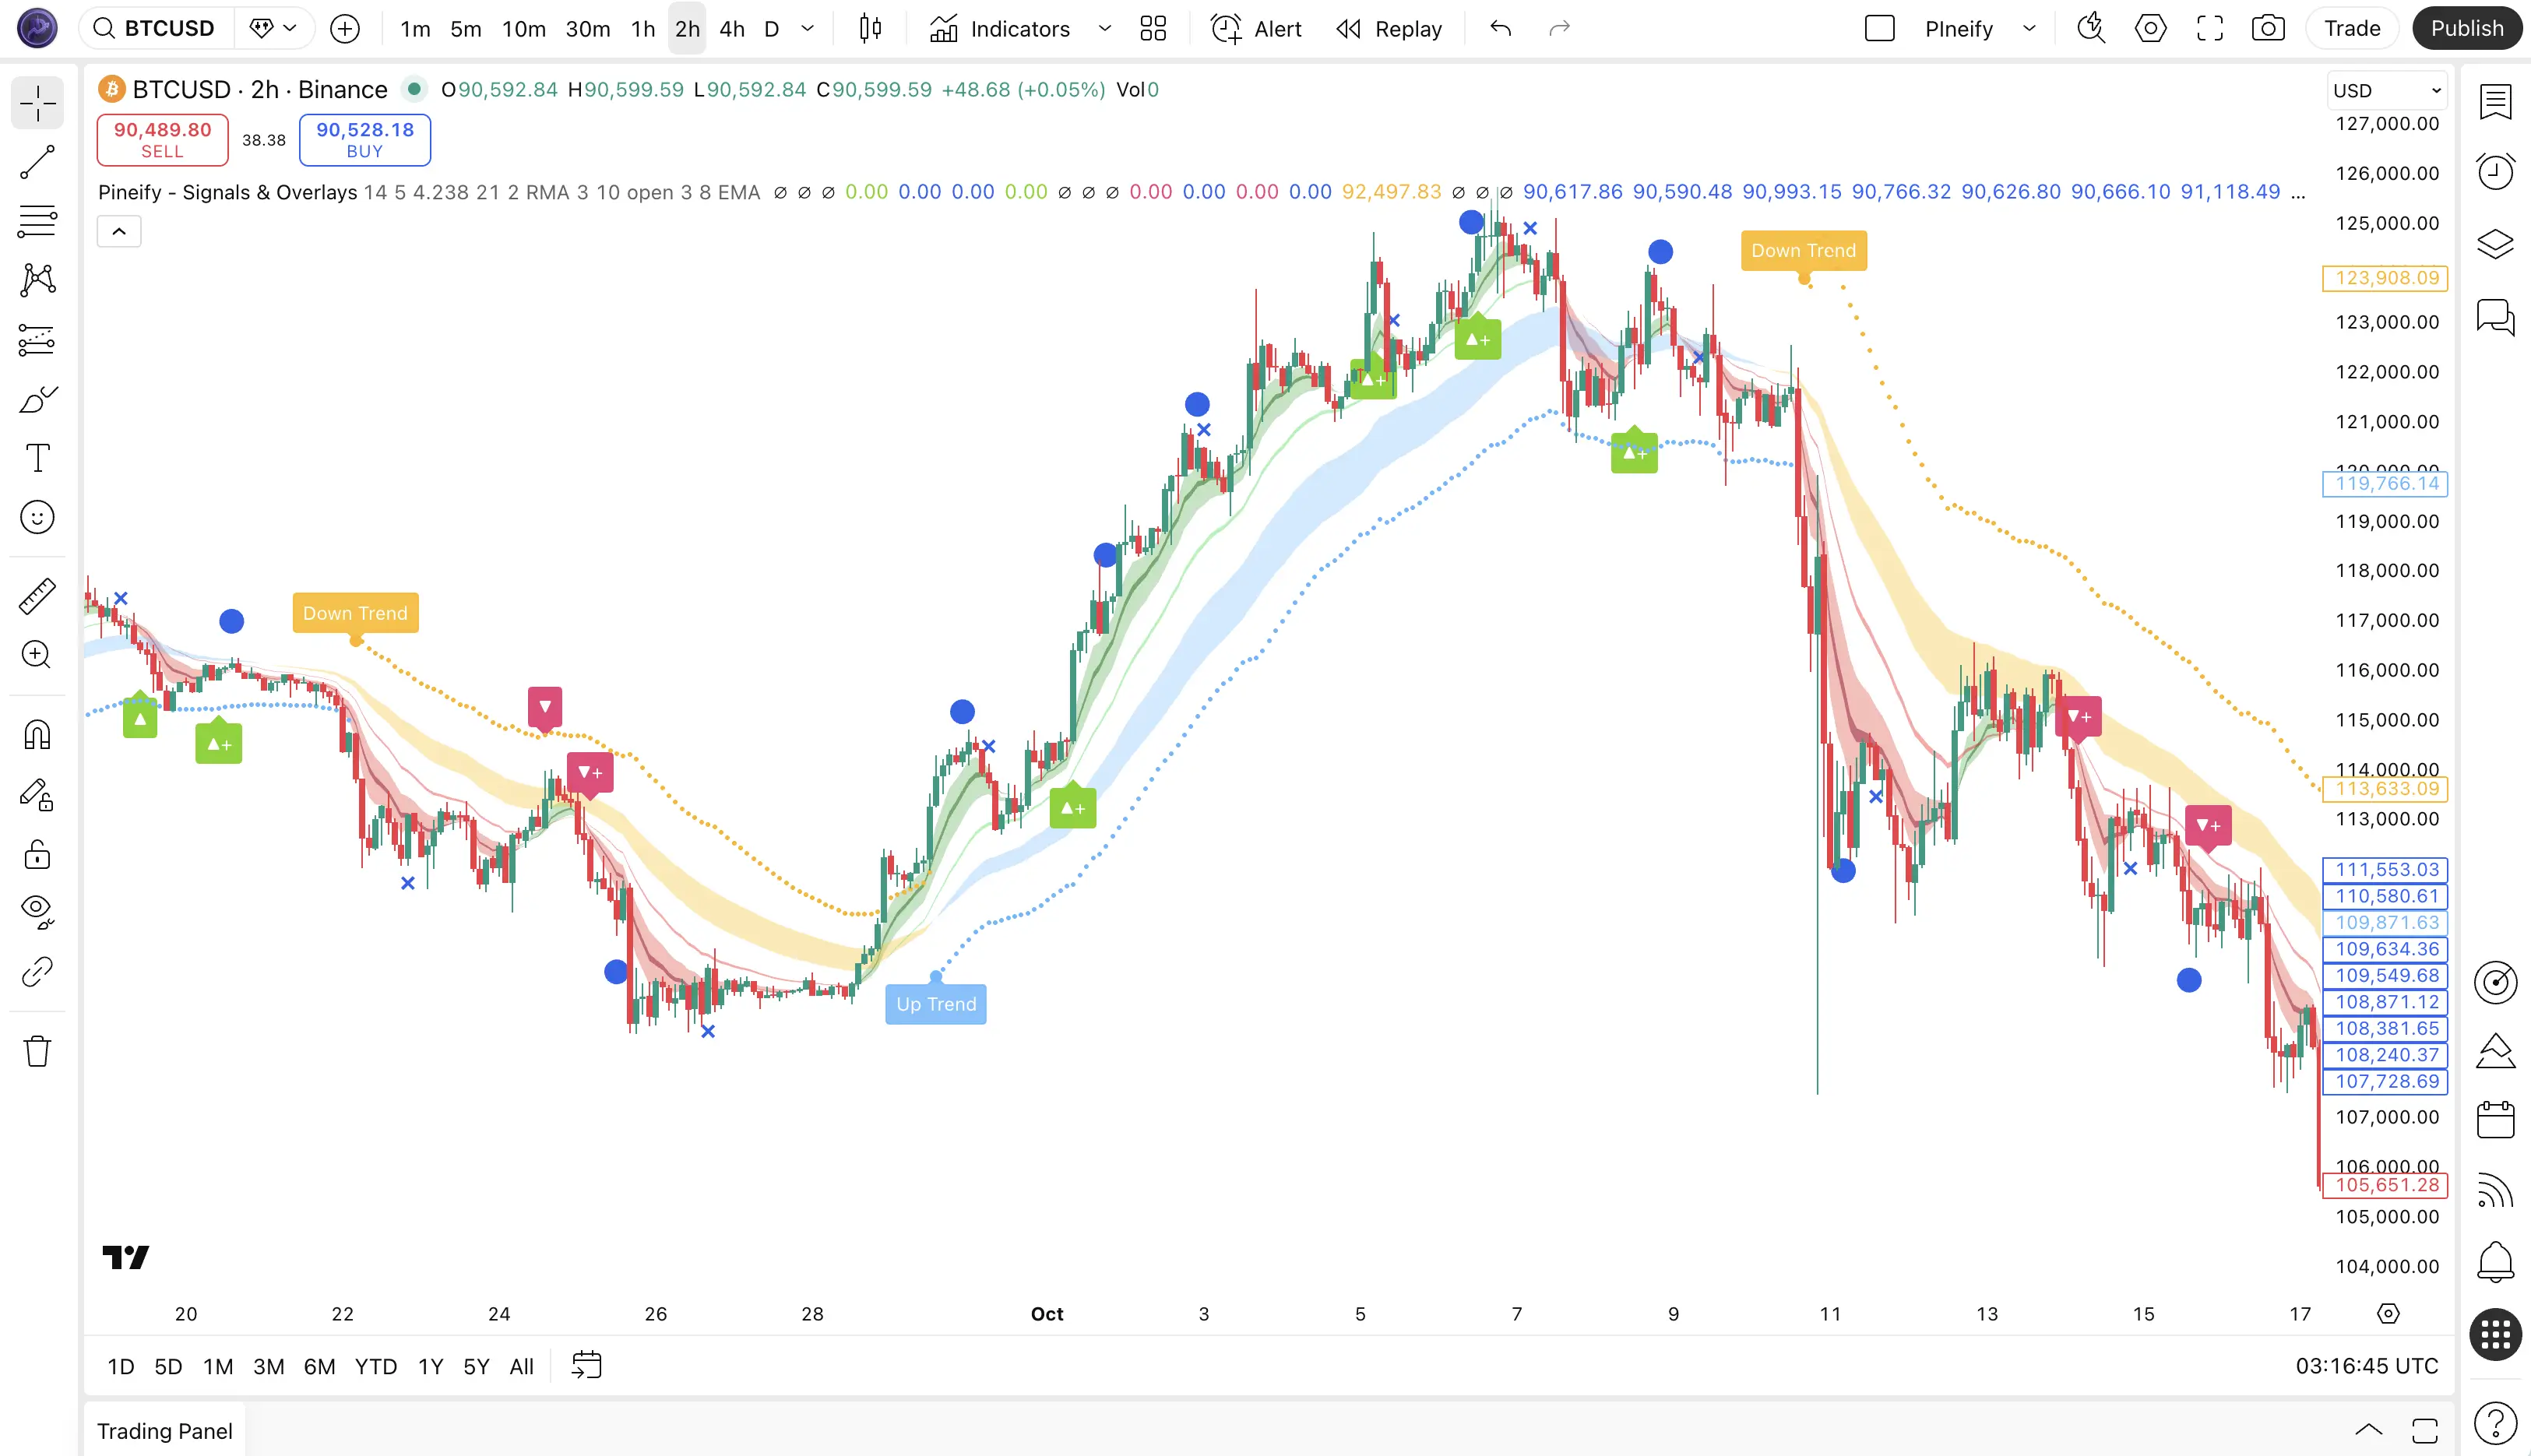
I tested Pineify's invite-only indicator against TrendSpider on AAPL and BTC-USD last month. My take: Pineify wins for traders who already use TradingView. Its unified scoring system—trend, momentum, volatility all baked into one number—saves you from bouncing between tabs. TrendSpider automates chart patterns on its own platform, but you still have to connect the signals yourself. Pineify's invite-only indicator is a TradingView-native tool that condenses four analytical layers into a single actionable signal.


Pineify's Invite-Only Indicator vs TrendSpider: Superior TradingView Analysis

Pivot Points High Low: Spot Support and Resistance in TradingView

· 10 min read
Pineify Team
Pine Script and AI trading workflow research team

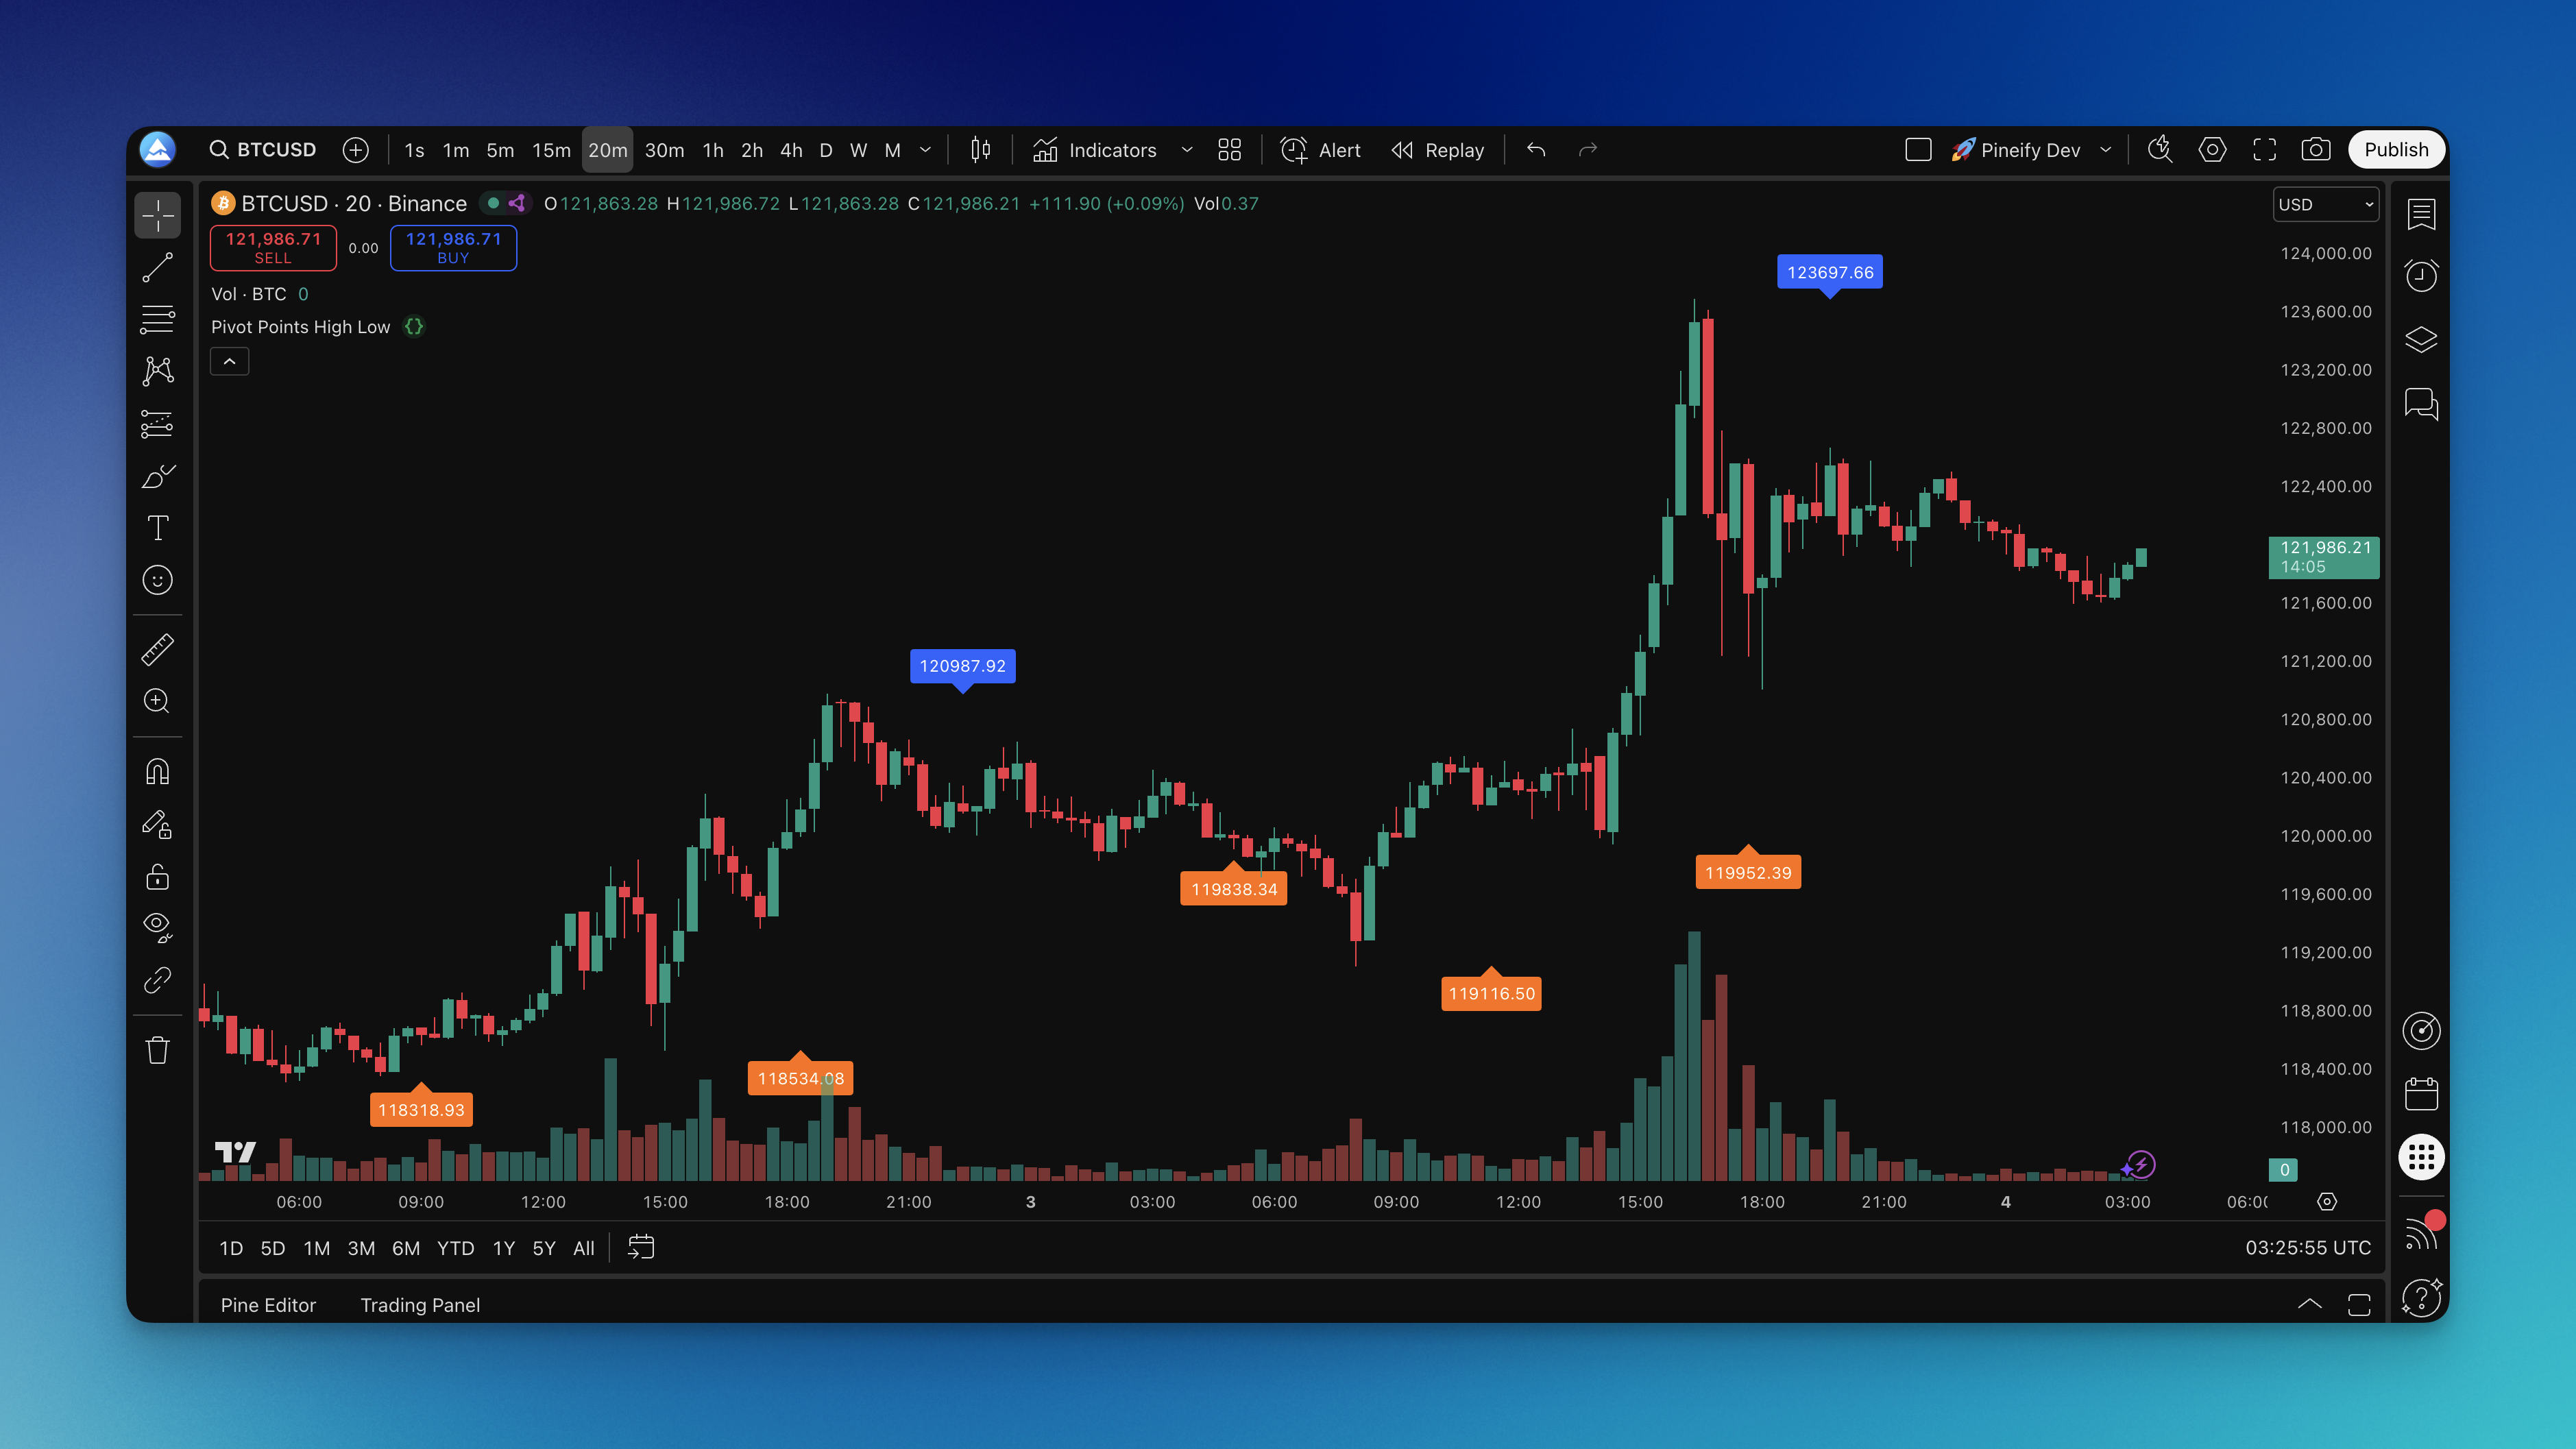
You know that moment when you're staring at a chart trying to figure out where price might bounce or break? I've been there more times than I care to count. The Pivot Points High Low indicator is a TradingView tool that automatically detects local highs and lows by scanning bars to the left and right of each turning point. It marks pivot highs with blue labels and pivot lows with orange labels, showing the exact price where buying or selling pressure took over.

This isn't about predicting the future. It's about seeing where price actually made its biggest decisions in the past — and using those levels to plan your next move.

Pivot Points High Low Indicator on Chart

Boosted.ai vs Pineify AI Finance Agent: Which Is Better?

· 15 min read
Pineify Team
Pine Script and AI trading workflow research team

Boosted.ai is an institutional AI research platform that processes over 120 billion data points a month for hedge funds. Pineify AI Finance Agent is a browser-based finance assistant that costs $99 once for individual traders. They're not competing in the same ring. I've tested both ecosystems enough to say this: if you manage institutional money, Boosted.ai is your tool. If you're a self-directed investor who wants live data, options analysis, and Pine Script coding without a sales call, Pineify wins.


Boosted.ai vs Pineify AI Finance Agent: Which AI Tool Is Better for Traders?

Pivot Points High Low Strategy for Trading Support and Resistance

· 13 min read
Pineify Team
Pine Script and AI trading workflow research team

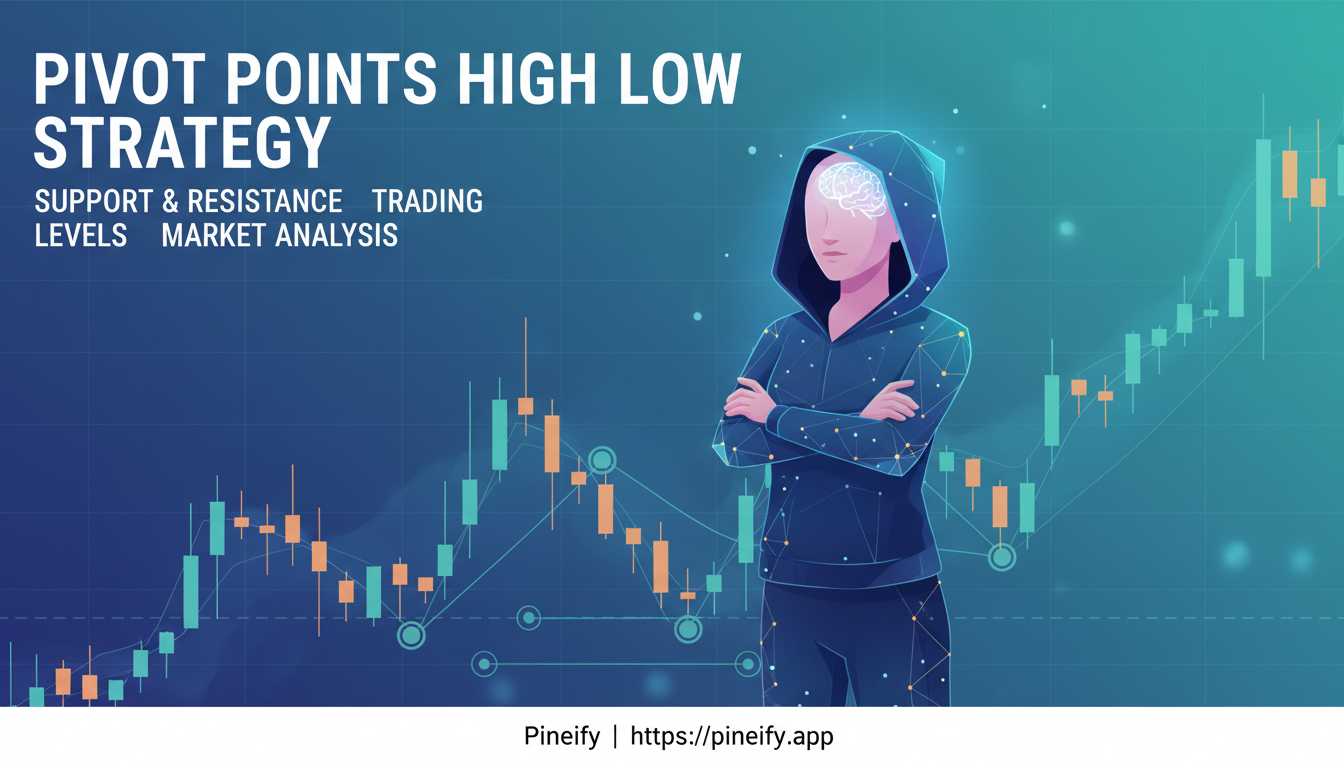
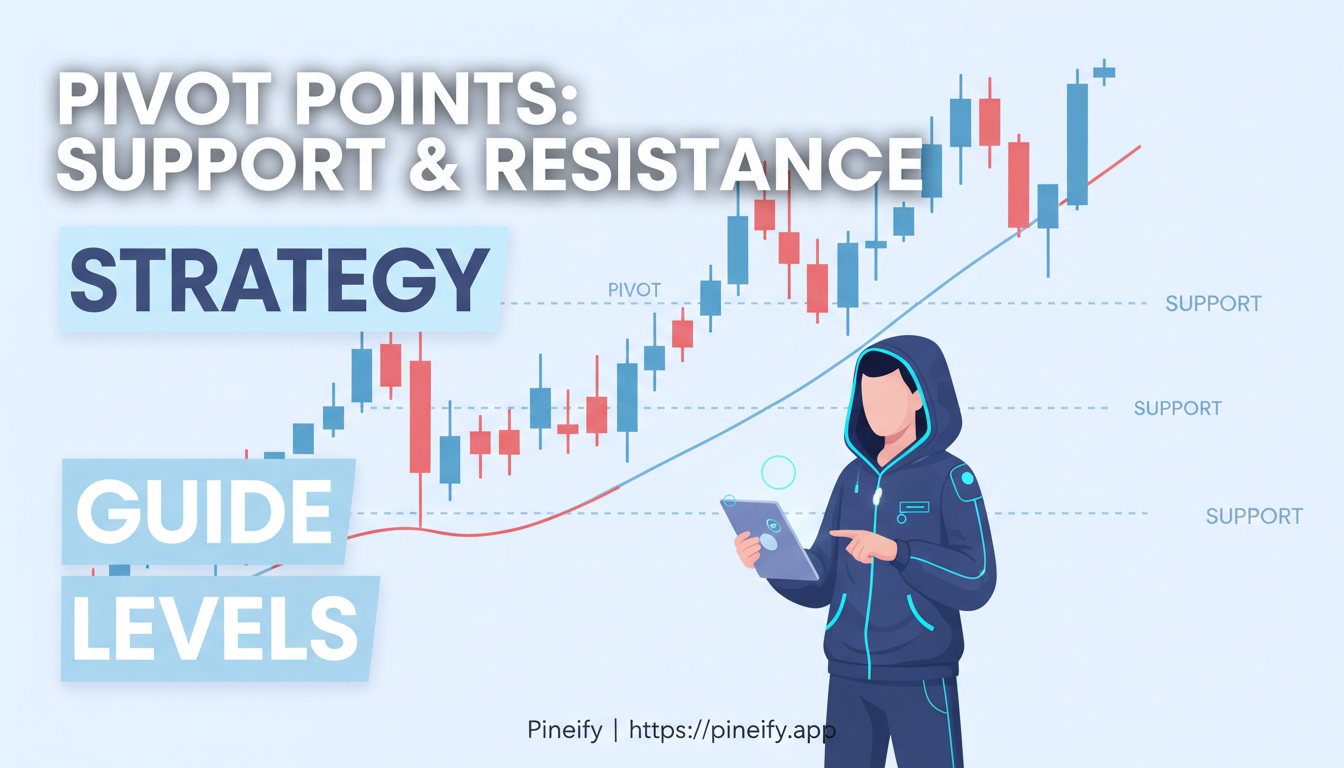
A pivot points high low strategy is a technical analysis method that maps where support and resistance levels will form based on the previous session's highs, lows, and closes. I've been trading this on SPY since early 2025, and the daily S1 bounce setups hold up well through both trending and choppy markets. It doesn't work every time, but it gives me a clear, repeatable map of where price might pause or reverse.

Pivot Points High Low Strategy: Master Trading Support and Resistance Levels

Pivot Points Trading Strategy: Trade Support and Resistance Levels

· 20 min read
Pineify Team
Pine Script and AI trading workflow research team

I've been trading pivot points on EUR/USD for over two years now, and I can tell you one thing — they work, but not the way most beginners expect. If you're day trading or making short-term moves in the S&P 500 futures, you've probably heard traders talk about "pivot points." The Standard Pivot Points strategy is a favorite for a good reason. It gives you a straightforward way to spot where the price might find a floor or hit a ceiling, using nothing but yesterday's data.

Think of it as a map drawn from the previous session's battle. By using yesterday's high, low, and closing prices, this method plots out key levels where the price is more likely to stall, reverse, or break out. I've seen it work beautifully on quiet Monday mornings and fail completely on Fed announcement days.

Pivot Points Trading Strategy: Complete Guide to Support & Resistance Levels

Premium Pine Scripts: Source Code Access, Lifetime Pricing

· 12 min read
Pineify Team
Pine Script and AI trading workflow research team

Free TradingView scripts are everywhere. Finding one you can actually trust is the hard part. Most ship with zero documentation, hidden source code, and signals that look reliable in screenshots but fall apart in live markets. I learned this the expensive way last November: I tested five free momentum indicators on AMD daily charts, and three of them repainted after the bar closed. Useless for real entries.

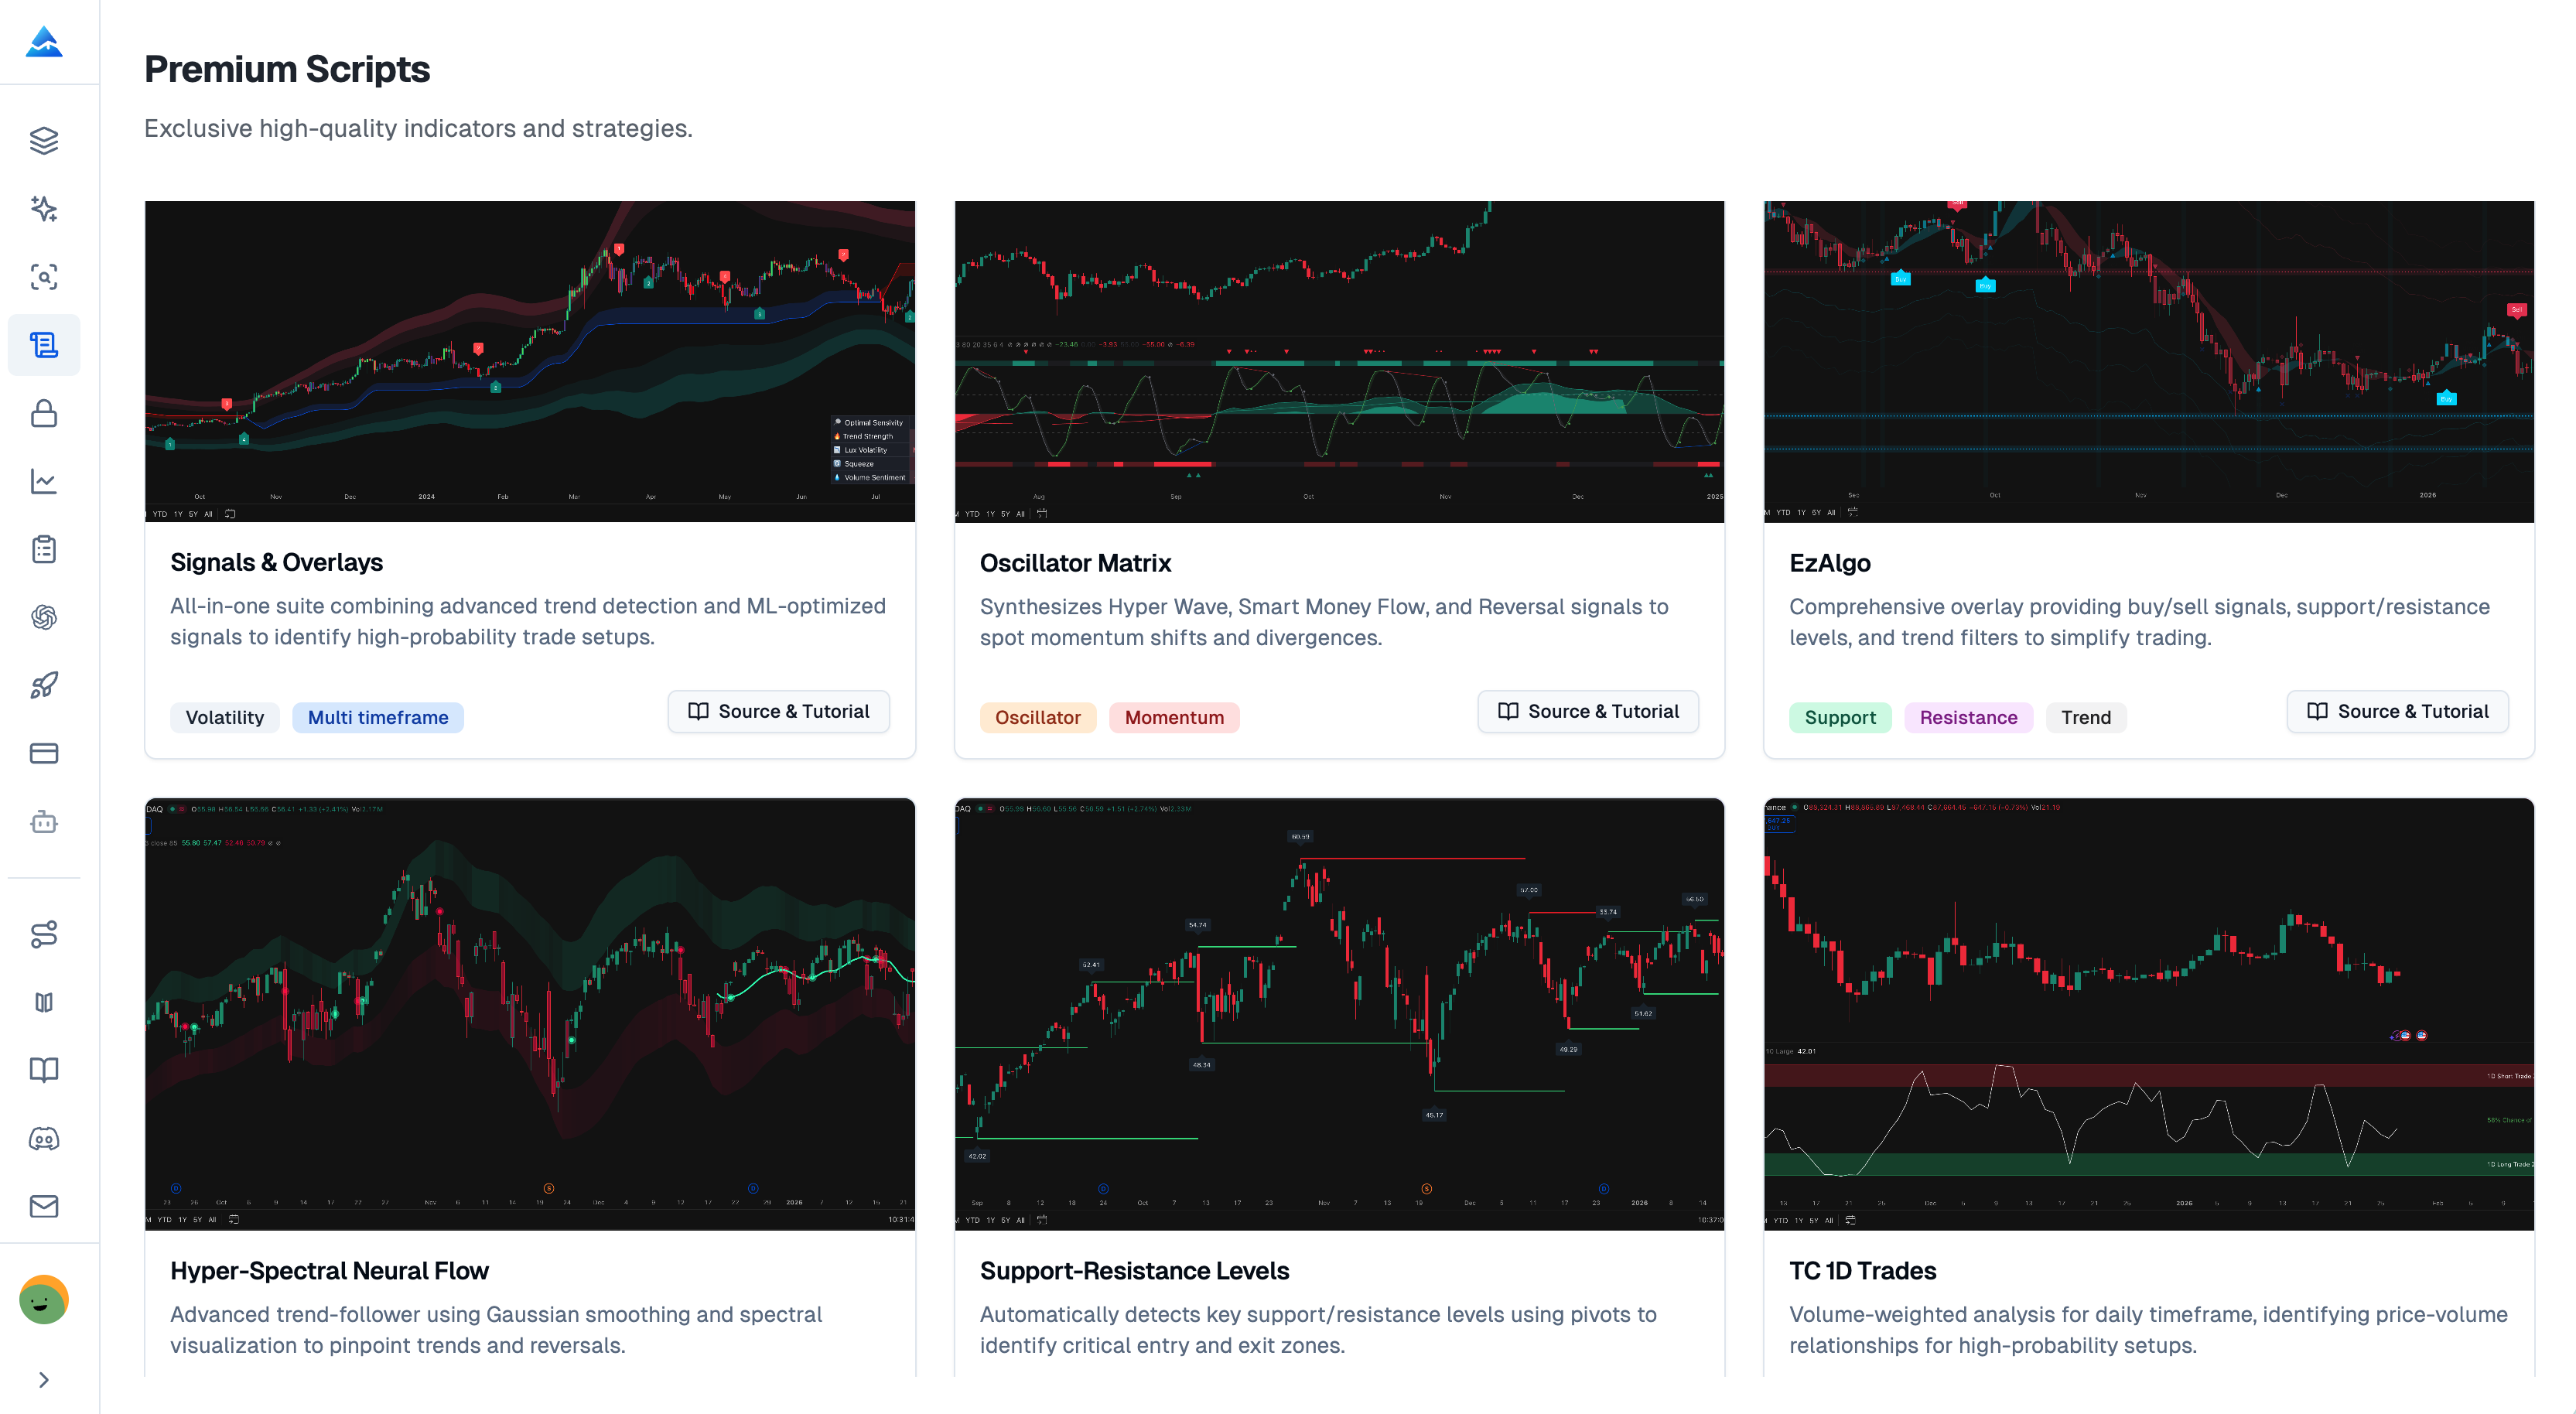
Pineify Premium Scripts is a members-only library of advanced TradingView indicators and strategies built around source code transparency and consistent signal quality. Every script includes the full, unencrypted Pine Script code, step-by-step documentation, and adaptive logic tested across stocks, forex, and crypto.


Premium Pine Scripts: Why Pineify Outperforms TradingView Competitors

Price Momentum Oscillator: Catch Momentum Shifts Early

· 13 min read
Pineify Team
Pine Script and AI trading workflow research team

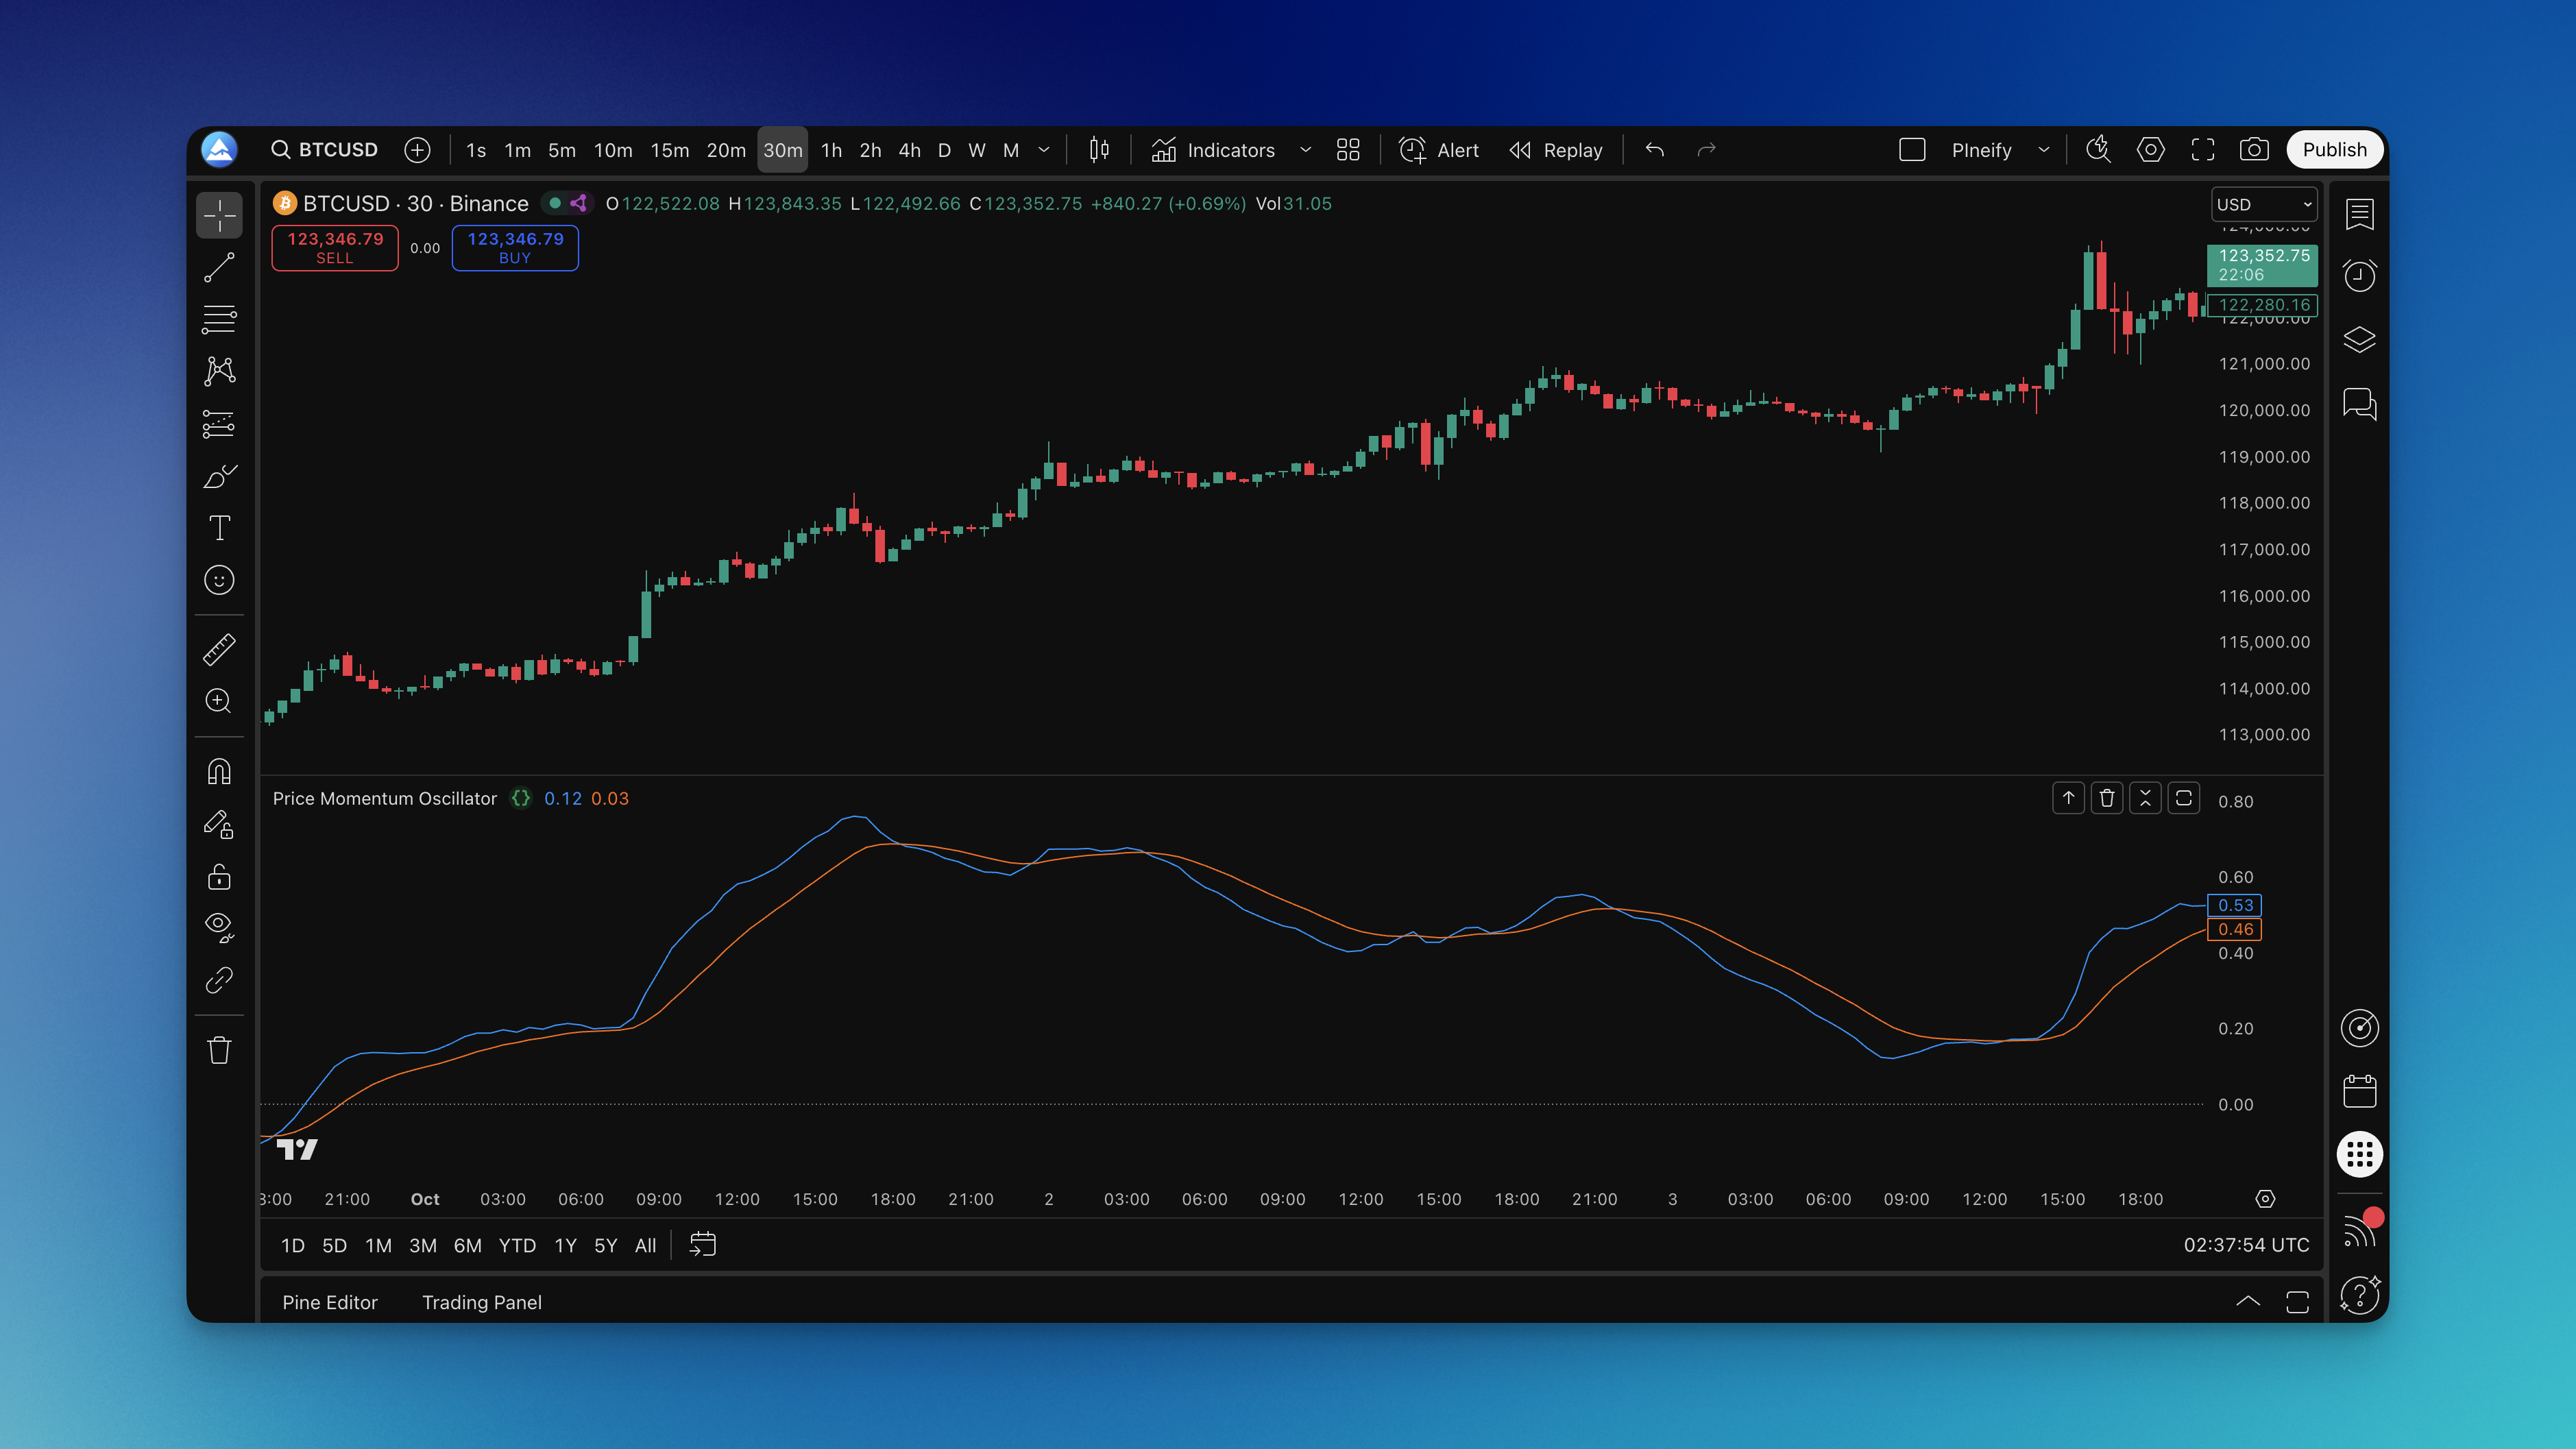
Ever watched price momentum shift right before your eyes, but your indicators were still showing the old trend? The Price Momentum Oscillator (PMO) solves that problem with a double-smoothing technique that catches momentum changes before they become obvious. It calculates the rate of change in price, then applies two layers of exponential smoothing, producing a main PMO line and a signal line that oscillate around zero.

Price Momentum Oscillator Indicator on Chart

PMO Strategy: Price Momentum Oscillator Signals for Better Trades

· 15 min read
Pineify Team
Pine Script and AI trading workflow research team

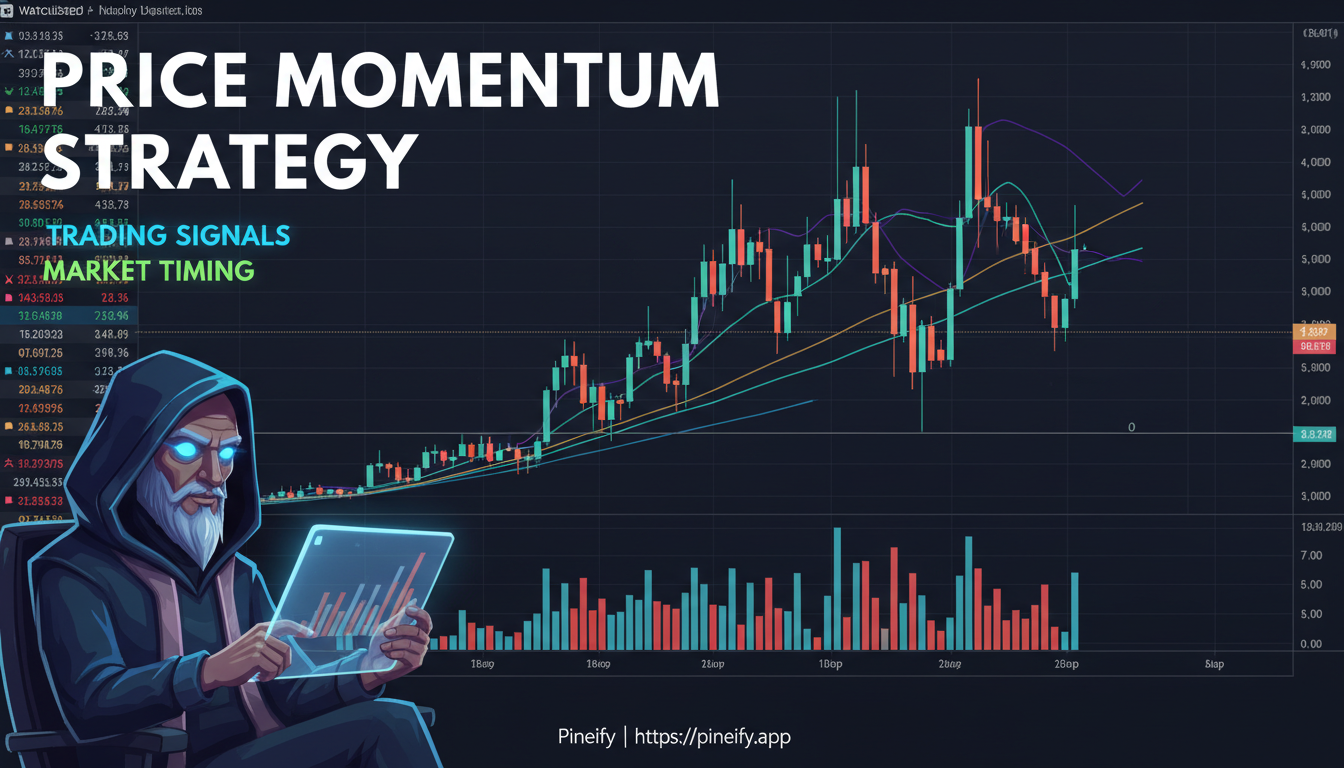
The Price Momentum Oscillator (PMO) is a double-smoothed momentum indicator designed to track price speed while filtering out the noise that makes simpler oscillators jumpy. Carl Swenlin built it with two custom smoothing passes instead of the standard EMA approach most indicators use. I've had it on my AAPL chart since February 2024, and the divergence signals alone have flagged reversals that raw price action completely missed. Pair it with a solid best buy sell strategy TradingView and you get a clearer read on when momentum is actually shifting.

Price Momentum Oscillator Strategy: Master PMO Trading Signals for Better Market Timing

Price-Volume Trend Indicator: TradingView Pine Script Guide

· 17 min read
Pineify Team
Pine Script and AI trading workflow research team

Ever wondered why some price moves stick around while others disappear faster than your morning coffee? The secret lies in volume — the real engine behind every price movement. That's where the Price-Volume Trend (PVT) indicator becomes your trading compass.

The Price-Volume Trend indicator is a cumulative momentum tool that tracks buying and selling pressure over time. It combines price and volume data to show you whether the moves behind a trend are genuine or just market noise. Unlike basic volume indicators that only tell you how much trading happened, the PVT reveals whether that volume actually supports the trend or fights against it.

Here's how it works: when prices close higher than yesterday, the PVT adds that day's volume to a running total. When prices close lower, it subtracts the volume. This creates a cumulative line that tracks real buying and selling pressure. When both price and PVT climb together, you're seeing authentic buying interest. When they start moving in opposite directions? That's your early warning system for potential trend changes.

Think of it as a truth detector for price movements — separating real market conviction from temporary excitement.