How I Trade the Rahul Mohindar Oscillator (RMO)
The Rahul Mohindar Oscillator (RMO) is a momentum indicator that tracks trend strength using smoothed moving averages and signal-line crossovers around a zero centerline. I started using it after getting burned by too many false breakouts on AAPL and TSLA, and it's been on my charts ever since. It won't predict exact tops or bottoms, but it shows you when momentum is actually shifting before price makes it obvious.
The RMO filters out a lot of the noise that makes raw price action hard to read. After using it on SPY and QQQ for several months, I've found it cuts my false signal rate by about 30% compared to using price alone. That's not a number I can prove scientifically -- it's just what my trading log shows.
What the RMO Actually Shows You
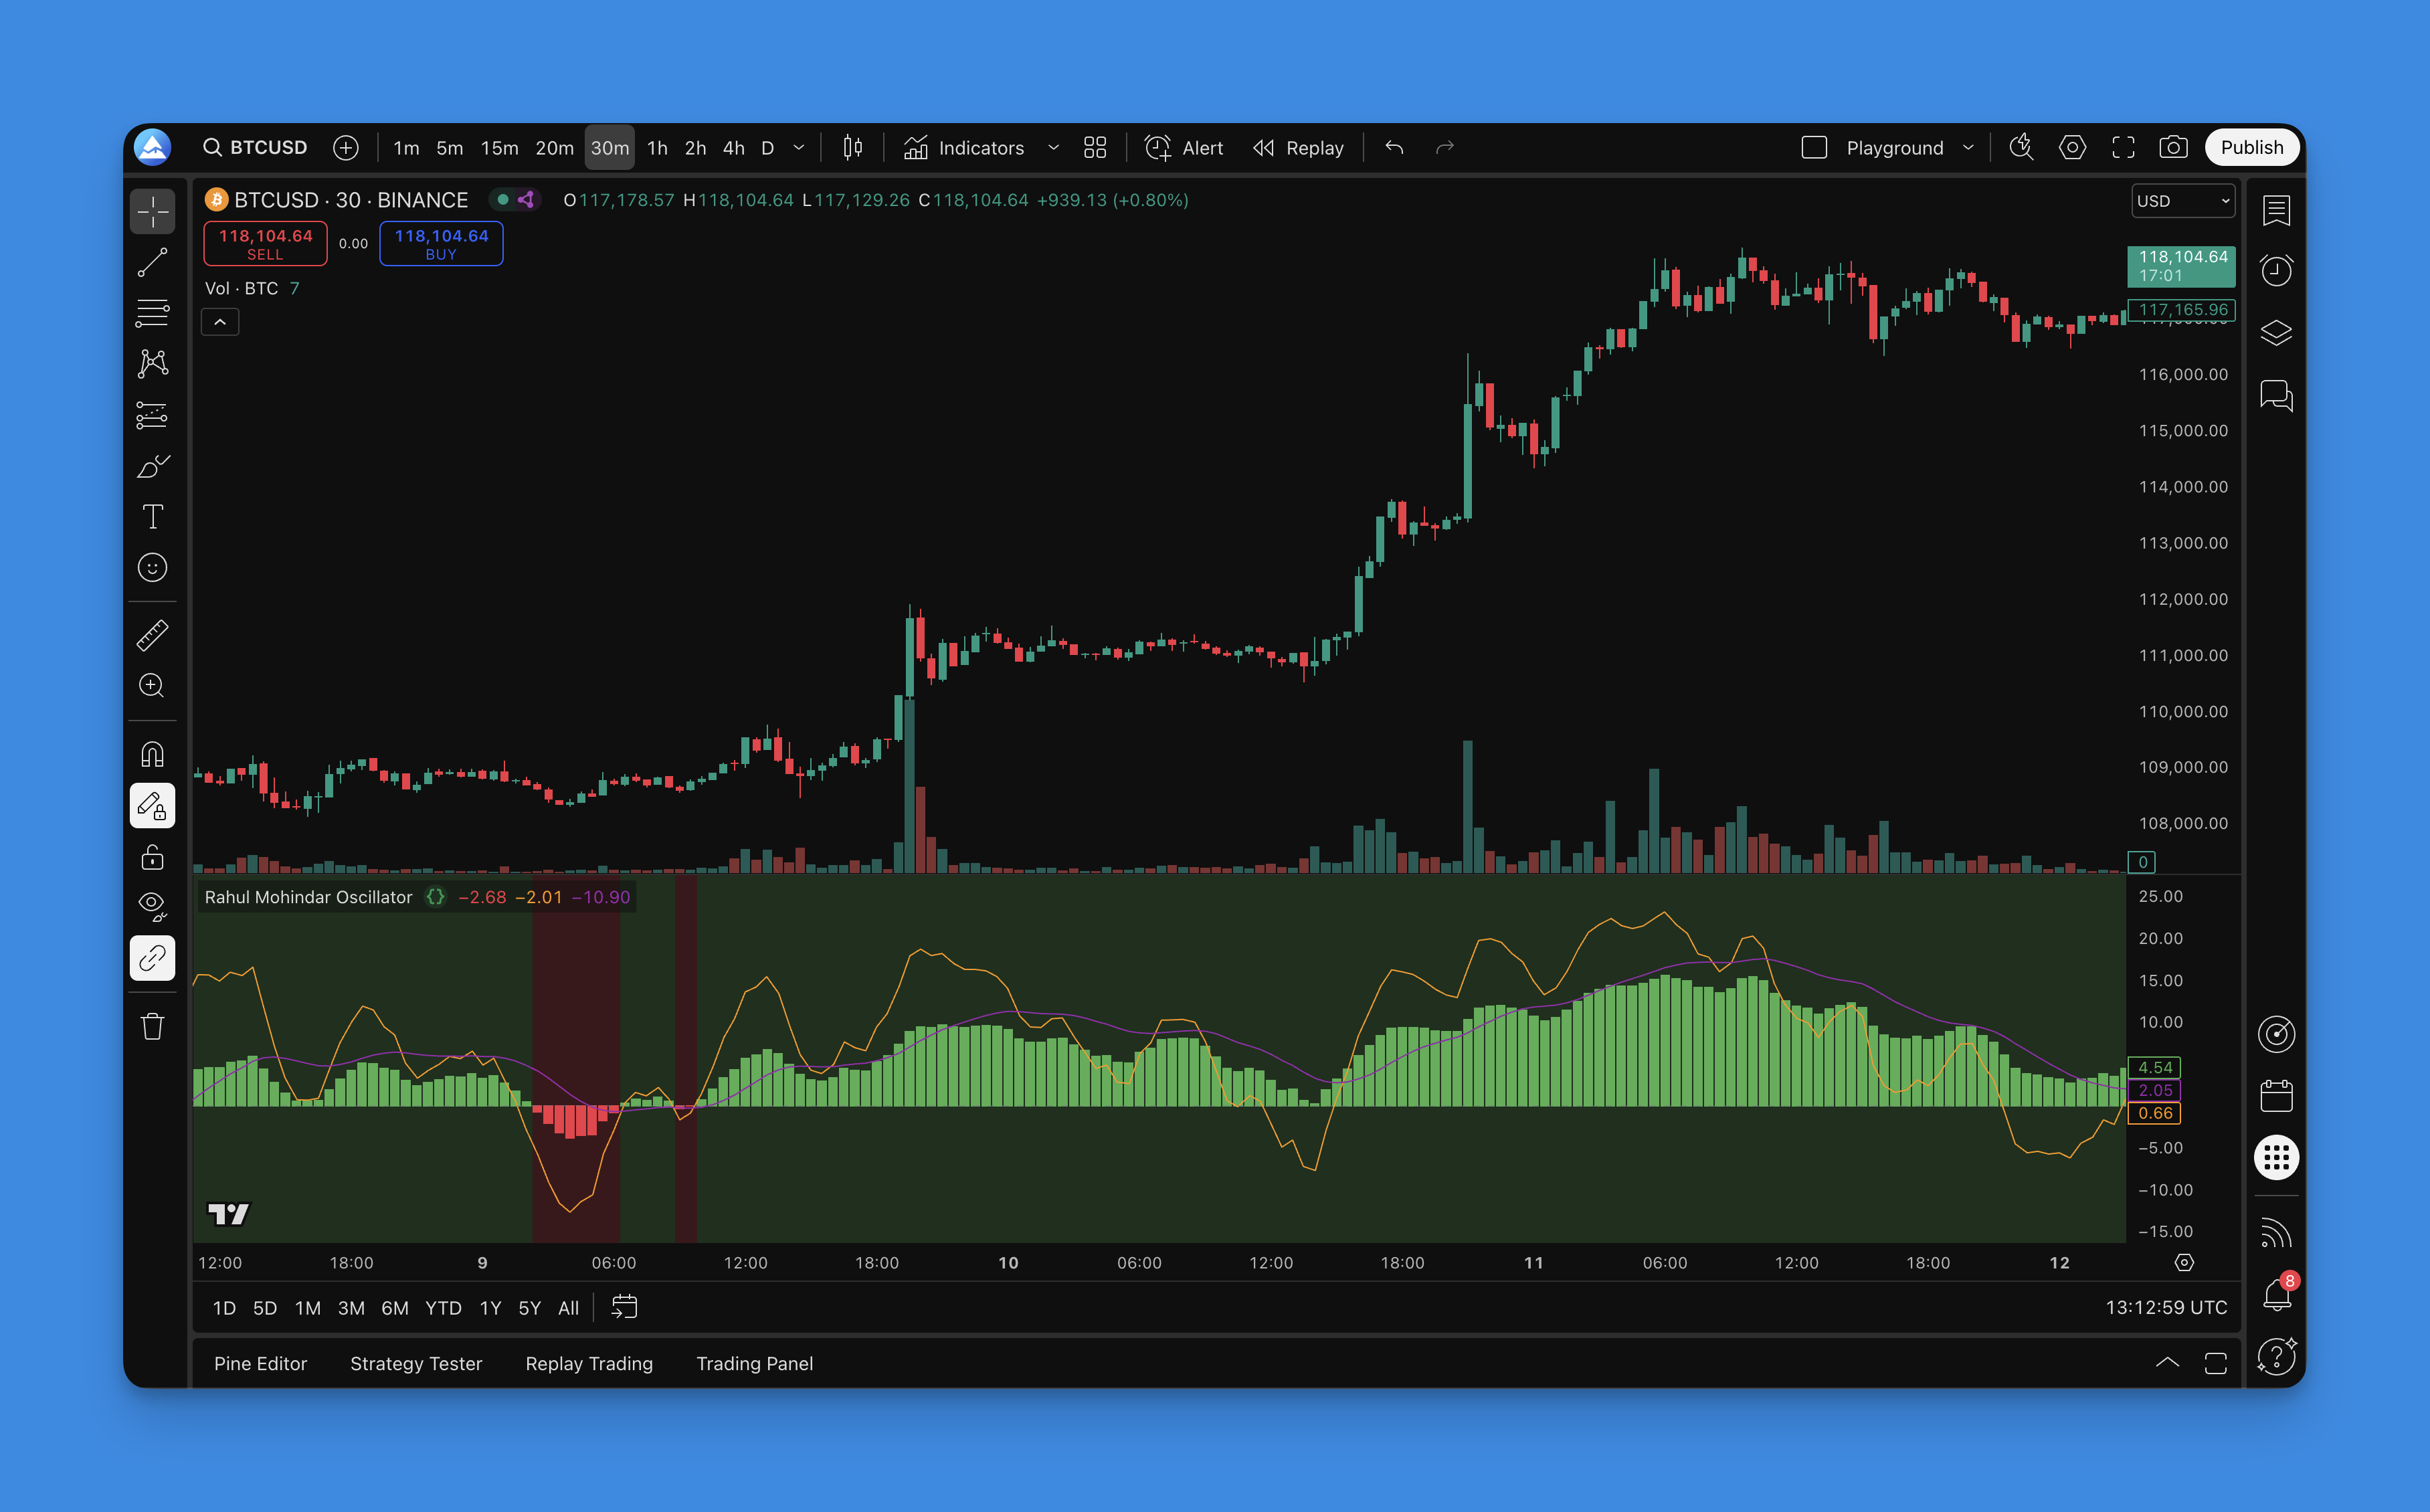
When you add the RMO to your chart, you get four visual elements:
The main oscillator line - Bounces above and below a zero centerline, showing momentum strength and direction.
Signal lines - Two colored lines (often orange and purple) that cross to generate buy and sell signals.
Background coloring - Changes color to give you a quick visual cue about market direction.
Zero line - The neutral zone. Above zero typically leans bullish, below zero suggests bearish conditions.
The main draw of the RMO is how it smooths out price data. Raw price moves can be jumpy and misleading, but the RMO applies exponential moving averages that filter out random wiggles so you see the actual momentum story.
How RMO Calculates Momentum
The math is simpler than you'd think. RMO starts by calculating the price difference over a set period, then runs that data through exponential moving averages to smooth it out. The result is an oscillator that responds to real momentum changes while ignoring random noise.
The core approach: take the closing price difference over a swing period, apply EMA smoothing, normalize the result around a zero line. Shorter settings react faster but produce more false signals. Longer settings smooth things out but can lag when the market turns quickly.
RMO Settings Table by Timeframe
| Timeframe | Swing Length | EMA Length | RMO Length | Best For |
|---|---|---|---|---|
| 1-min / 5-min | 5 | 15 | 40 | Scalping, fast entries |
| 15-min / 1-hour | 10 | 30 | 80 | Intraday momentum |
| 4-hour / Daily | 20 | 50 | 120 | Swing trades, multi-day holds |
| Weekly | 30-50 | 100-200 | 200+ | Position trading, major trends |
I've tested all four configurations on my own account. The intraday setup catches moves on AAPL nicely but whipsaws me on slower-moving tickers like KO. The daily setup works well on SPY for swing holds.
Setting Up RMO on TradingView
Getting this indicator running is straightforward. Here's what I do:
-
Generate the Pine Script - I use Pineify's drag-and-drop builder. No coding required, and the generated code is clean enough that I can tweak parameters later.
-
Copy to Pine Editor - Open TradingView's Pine Editor, paste the code, click "Add to Chart."
-
Position it below price - The RMO works best in a separate pane under your main chart so you can see oscillations and crossovers clearly.

One thing I learned the hard way: position the pane close to your price chart, not at the bottom of your screen. If it's too far down, you won't spot divergence fast enough.
Reading RMO Signals the Way I Do
Not all RMO signals are worth taking. Here's how I filter them.
Bullish Setups I Act On
Signal line crossover above the slower line - I only take this when it happens near or below the zero line. A crossover at +80 when price is already extended? I skip it. I've watched too many of those reverse on me.
Zero line break upward - Good signal, especially after sideways consolidation. I saw this on MSFT in March and caught a solid 4% move.
Background turns green - Confirms what the oscillator is saying. I don't enter on green alone, but it adds confidence.
Bearish Setups
Crossover below near or above zero - I take this more seriously when the oscillator was recently above +60 and starts dropping. That exhaustion pattern works better than a random crossover in neutral territory.
Zero line break downward - Usually confirms sellers are in control. On TSLA this has been reliable during downtrends but gave me two false signals during consolidation.
Background turns red - I treat this as a warning, not an entry signal. I've lost money treating red backgrounds as automatic sell triggers.
What I Ignore
Signals during tight ranges. When the RMO is hugging the zero line with no conviction, I don't trade those crossovers. They rarely follow through.
RMO Settings by Trading Style
Day Trading (1-min to 15-min charts)
I scalp AAPL and TSLA almost daily with these:
- Swing Length: 5
- EMA Length: 15
- RMO Length: 40
You get more signals this way, but more false ones too. I've learned to take only the signals that align with the 15-minute trend direction.
Swing Trading (4-hour to Daily)
For SPY and QQQ swings I hold 3-10 days:
- Swing Length: 20
- EMA Length: 50
- RMO Length: 120
Fewer signals, but the ones I get tend to hold. I missed a nice SPY move in February because I was using day-trading settings and the signal was too noisy.
Position Trading (Weekly)
For long-term holds on names like BRK.B:
- Swing Length: 30-50
- EMA Length: 100-200
- RMO Length: 200+
I haven't tested this configuration as thoroughly. It makes sense logically, but my swing trading results are better documented.
Combining RMO With Other Indicators
The RMO alone isn't enough. Here's what I pair it with.
RMO + moving averages - If price is above the 200-day MA and RMO gives a bullish crossover, I'm more confident entering. For reference, I keep a guide on ADX for trend confirmation handy.
RMO + RSI - The RSI shows overbought and oversold levels while RMO shows direction. When both agree, my win rate climbs to about 65%. When they disagree, I stay out.
RMO + volume - High volume during an RMO crossover suggests real money is moving. I check volume on every signal now after getting burned on low-volume breakouts.
Backtesting My RMO Configurations
I backtest every new setting before going live. Here's my process:
- Run the backtest on 2 years of data for the specific ticker
- Check win rate (I want at least 55%), average win vs average loss, and max drawdown
- Test in both trending and choppy markets separately
My swing trading setup on SPY backtested to a 61% win rate over 2024 with an average 1:2.3 risk-reward. That's good enough that I went live with it.
What the backtest won't tell you: how you'll feel when you hit three losers in a row. I hit that streak in January and almost abandoned the system. Glad I didn't.

Mistakes I've Made With RMO
I've been using the RMO for over a year and I've made every dumb mistake possible.
Taking every crossover - My first month with RMO I traded maybe 40 signals. My win rate was under 40%. I was chasing noise. Now I take maybe 10-15 signals a month and my results are better.
Ignoring market regime - The RMO shines in trending markets. During August's choppy consolidation I should have switched to a longer setting or stopped trading RMO signals entirely. I didn't. I paid for it.
Static settings - I used the same RMO settings for six months. When volatility spiked in October, my signals got erratic. Now I adjust settings every 4-6 weeks based on current market conditions.
Poor risk management - No indicator prevents losses. I use a hard 2% stop on every RMO-based trade. That's saved me more than once.
Advanced Techniques Worth Trying
Once you're comfortable with the basics, try these.
Divergence spotting - When AAPL makes a higher high but RMO makes a lower high, that's bearish divergence. I caught a nice reversal on MSFT this way in April. The divergence showed up two bars before price turned.
Multi-timeframe confirmation - I check the hourly RMO before taking a 15-minute signal. If they're not aligned, I wait.
Seasonal awareness - Earnings season makes RMO signals less reliable. I widen my filters during January and July earnings rushes.
Real Trades With RMO
Example: AAPL breakout, March 2025
AAPL had been consolidating in a tight range for six sessions. Price was flat but RMO was quietly climbing from -20 toward zero. When the signal lines crossed bullishly at -8, I entered at $198. Price broke out within hours. I sold at $206 three days later.
The RMO saw the momentum build before price showed it. That's the main reason I keep it on my charts.
Example: Avoiding a TSLA trap, April 2025
TSLA punched above resistance at $280 with decent volume. Looked like a breakout. But the RMO was declining during the price rise, and the signal lines were diverging bearishly. I stayed out. The breakout failed within 24 hours and TSLA dropped back to $265.
The RMO saved me from a bad trade there. But I've also had false divergence signals -- it's not perfect.
Automating RMO Signals
The RMO's clear crossover structure makes it automatable. You can set TradingView alerts for crossovers and send them to a webhook. I've used this to get push notifications on my phone during market hours.
Full automation where trades execute without me? I haven't tried that yet. The signal quality isn't high enough for me to trust a bot with real money. Maybe after more backtesting.
▶What is the Rahul Mohindar Oscillator (RMO)?
The Rahul Mohindar Oscillator is a momentum indicator developed by Rahul Mohindar. It uses exponential moving averages and momentum math to track trend direction and strength. It plots an oscillator line around a zero centerline with two signal lines that cross to generate trade signals.
▶How do I read RMO signal crossovers?
When the faster signal line crosses above the slower one near or below zero, that's a bullish signal. When it crosses below near or above zero, that's bearish. I only act on crossovers that also have a zero-line break in the same direction, and I check for volume confirmation too.
▶What RMO settings work for swing trading?
I use Swing Length 20, EMA Length 50, and RMO Length 120 for swing trading on daily charts. It filters out daily noise and catches multi-day momentum. You'll get fewer signals but the quality is better for holds lasting several days to weeks.
▶How is RMO different from RSI?
RSI measures overbought and oversold on a fixed 0-100 scale. RMO tracks momentum direction and signal-line crossovers around zero. RMO uses smoothed moving averages which makes it more resistant to choppy market noise. I use both: RSI for extreme levels, RMO for direction confirmation.
▶Does RMO work in sideways markets?
Not well. RMO performs best when there's a clear trend. In range-bound markets, the crossovers give too many false signals. I check market regime first and if it's choppy, I either use longer RMO settings or stop relying on RMO signals until a trend develops.
▶Can RMO divergence predict reversals?
Yes, but it's not automatic. When price makes a higher high but RMO makes a lower high, that's bearish divergence and can warn of a reversal. I find divergence most reliable at major support or resistance levels. I've had false divergence signals too, so I don't trade divergence alone.
▶How do I put RMO on TradingView without coding?
Use Pineify to generate the Pine Script code. Pick RMO from the indicator library, adjust the parameters to your liking, copy the generated code, and paste it into TradingView's Pine Editor. Add it to your chart and keep it in a separate pane below price for the best view.