HalfTrend Indicator: Pine Script Trend & Buy/Sell Signals
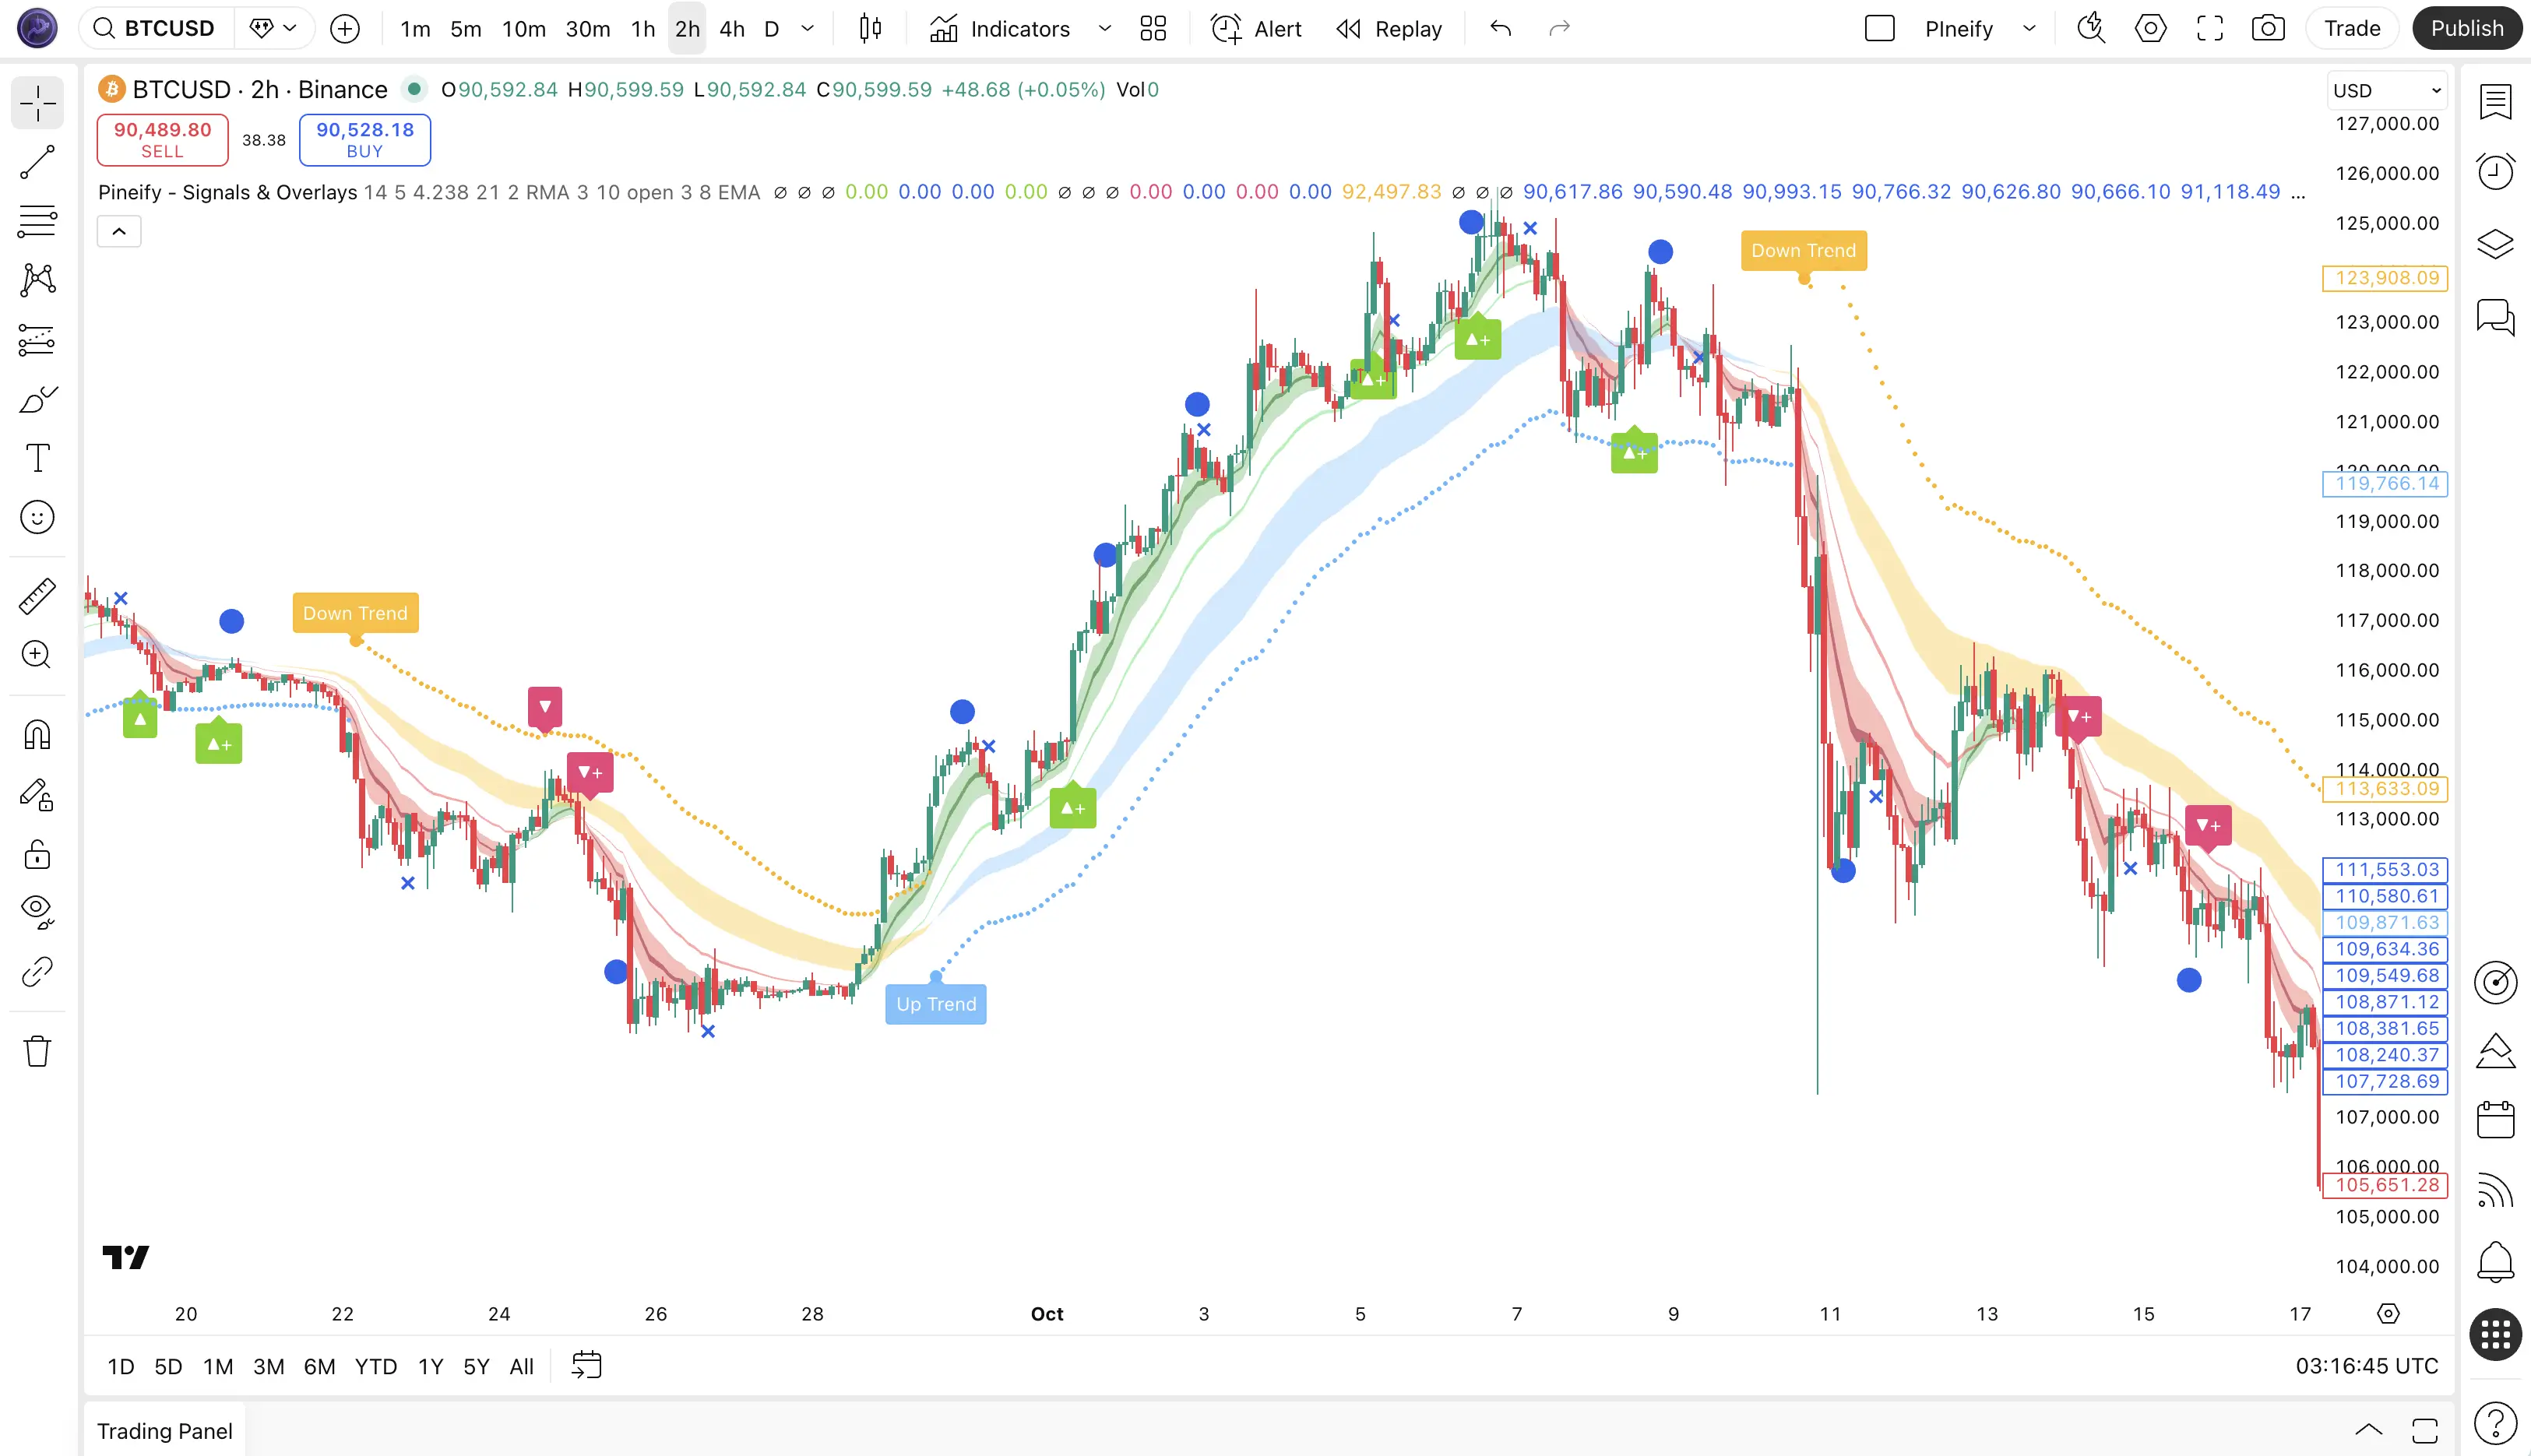
Knowing when the trend has actually flipped—instead of chasing noise—is one of the hardest parts of trend trading. I've found the HalfTrend (HT) indicator useful for that. It draws a single trend line that switches between support and resistance, plus an ATR-based channel around it, and it marks Buy and Sell only when the internal trend state changes. That keeps signals clear and avoids the clutter of many overlapping lines.
HalfTrend uses the Average True Range (ATR) and a short lookback (amplitude) to decide when price has broken the current structure. When the trend flips from down to up, you get a Buy signal and the line turns into support (often shown in blue); when it flips from up to down, you get a Sell signal and the line acts as resistance (often shown in red). The ATR High and ATR Low bands form a ribbon that shows the channel around the trend line. After testing it on BTCUSD daily and 4H timeframes for about four months, I prefer Amplitude 3 over the default 2 — it produced fewer false flips on that pair. I use HalfTrend mainly as a trend filter and for reversal entries when the arrow and Buy/Sell label appear.