HalfTrend Indicator: Pine Script Trend & Buy/Sell Signals
Knowing when the trend has actually flipped—instead of chasing noise—is one of the hardest parts of trend trading. I've found the HalfTrend (HT) indicator useful for that. It draws a single trend line that switches between support and resistance, plus an ATR-based channel around it, and it marks Buy and Sell only when the internal trend state changes. That keeps signals clear and avoids the clutter of many overlapping lines.
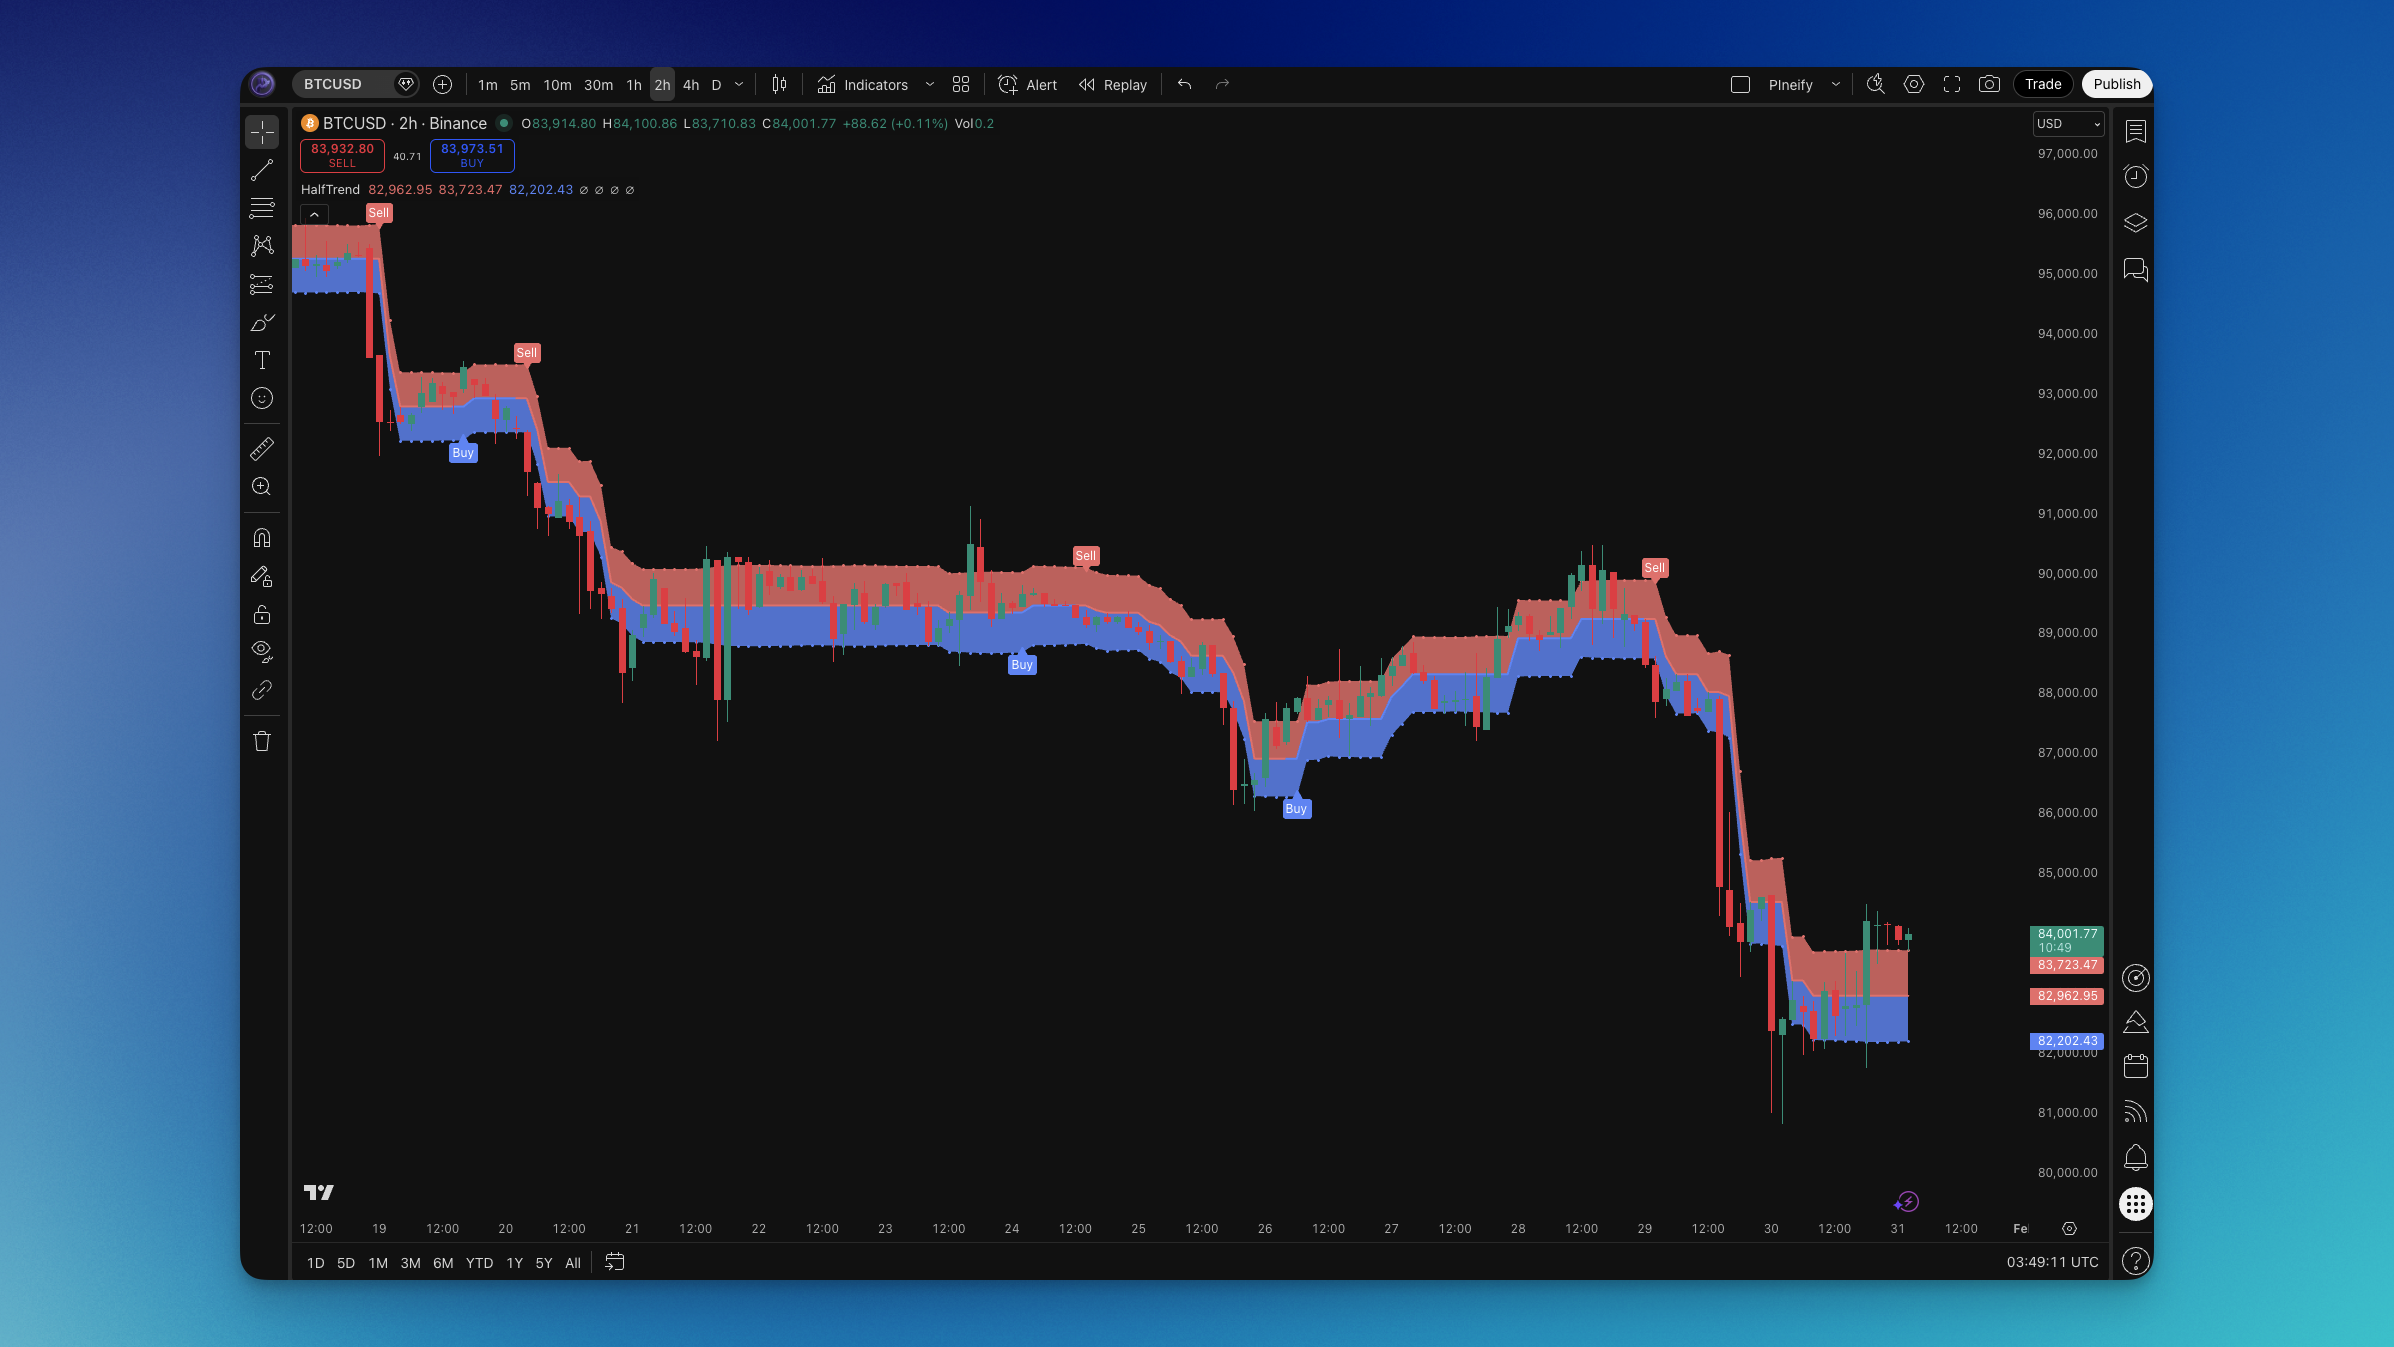
HalfTrend uses the Average True Range (ATR) and a short lookback (amplitude) to decide when price has broken the current structure. When the trend flips from down to up, you get a Buy signal and the line turns into support (often shown in blue); when it flips from up to down, you get a Sell signal and the line acts as resistance (often shown in red). The ATR High and ATR Low bands form a ribbon that shows the channel around the trend line. After testing it on BTCUSD daily and 4H timeframes for about four months, I prefer Amplitude 3 over the default 2 — it produced fewer false flips on that pair. I use HalfTrend mainly as a trend filter and for reversal entries when the arrow and Buy/Sell label appear.
What is HalfTrend?
HalfTrend (HT) is an overlay trend-following indicator that plots one main line (the HalfTrend line) plus an ATR-based channel (ATR High and ATR Low). The line switches between acting as support in uptrends and resistance in downtrends. Buy and Sell signals appear only when the internal trend state flips—not on every bar—which reduces noise compared to raw moving-average crossovers.
The logic is built from:
- Amplitude: Lookback period used to find the highest high and lowest low, and to compute SMAs of high and low. Default is 2; larger values smooth the trend but add lag.
- Channel deviation: Multiplier applied to half of the 100-period ATR to set the distance of the ATR High and ATR Low bands from the HalfTrend line. Default is 2; higher values widen the channel.
- ATR: The indicator uses
ta.atr(100) / 2(half of 100-period ATR) for both the arrow offset and, with channel deviation, the channel width. - Trend state: Internally the indicator tracks trend (0 = up, 1 = down) and next_trend. It flips to downtrend when the high SMA crosses below the tracked max low and close is below the prior low; it flips to uptrend when the low SMA crosses above the tracked min high and close is above the prior high.
- HalfTrend line (HT): In an uptrend it equals the "up" level (support); in a downtrend it equals the "down" level (resistance).
- Buy signal: Fires when trend switches from 1 to 0 (downtrend to uptrend).
- Sell signal: Fires when trend switches from 0 to 1 (uptrend to downtrend).
The ATR High and ATR Low bands form a ribbon around the HT line, so you can see the channel at a glance. What makes HalfTrend useful is the single line that changes role (support/resistance) and the explicit Buy/Sell only on trend change, which fits well with other trend tools such as Supertrend or SSL Channel for confirmation.
How to Add HalfTrend to TradingView

TradingView does not list a built-in indicator named "HalfTrend." You can add it in two ways:
Option 1 – Pineify (recommended)
- Open Pineify and open the Pine Script editor.
- Search for "HalfTrend" or "HT" in the indicator library.
- Add the indicator to your layout and adjust inputs (Amplitude, Channel Deviation) and style (Up/Down trend line, ATR High/Low, ribbons, arrows, Buy/Sell labels).
- Copy the generated Pine Script into TradingView's Pine Editor and add it to your chart.
Option 2 – TradingView Pine Editor
- In TradingView, open the Pine Editor and paste a HalfTrend script (e.g. from the community or the one ).
- Click "Add to chart." The indicator will overlay on the price chart.
- Open the indicator settings (gear icon) to change Amplitude, Channel Deviation, and visual options.
Typical inputs are: Amplitude (default 2; higher = smoother, more lag), Channel Deviation (default 2; higher = wider channel). The process with Pineify usually takes about five minutes including customization.
How to Use HalfTrend (Practical Trading Strategies)
HalfTrend works best as a trend filter and for reversal-style entries when the arrow and Buy/Sell label appear. I've tried it on AAPL and TSLA daily, and on EURUSD 4H — the trend filter approach worked better than taking every signal. Below are concrete ways to use it.
Strategy #1: Trend flip (Buy/Sell on signal only)
- Setup: HalfTrend on the chart; default Amplitude 2 and Channel Deviation 2, or your chosen values.
- Entry: Long on Buy signal (trend flips from down to up); short on Sell signal (trend flips from up to down). Optionally require a close beyond the HT line to avoid noise.
- Stop-loss: Below the recent swing low (longs) or above the recent swing high (shorts), or just beyond the opposite ATR band.
- Take-profit: Next opposite signal, or a fixed risk multiple (e.g. 1.5–2R).
Strategy #2: Trend filter for other entries
- Setup: Use HalfTrend to define bias: blue HT line and ribbon = only look for longs; red = only look for shorts.
- Entry: Use your usual entry (e.g. pullback to the HT line, breakout, or another indicator) but only when HalfTrend bias agrees.
- Stop-loss: Based on your entry method (e.g. below pullback low for longs).
- Take-profit: Your normal target or trailing stop.
Strategy #3: HT line as dynamic support/resistance
- Setup: In an uptrend, the HT line acts as support; in a downtrend, as resistance. Use the ATR bands as a buffer.
- Entry: Long on a pullback to the HT line (or ATR Low) in an uptrend with no Sell signal yet; short on a rally to the HT line (or ATR High) in a downtrend with no Buy signal yet.
- Stop-loss: Below ATR Low (longs) or above ATR High (shorts).
- Take-profit: Next opposite HalfTrend signal or a logical level.
Strategy #4: Multi-timeframe HalfTrend
- Setup: Check HalfTrend on a higher timeframe (e.g. daily) for trend; use a lower timeframe (e.g. 4H or 1H) for timing.
- Entry: When higher-timeframe HalfTrend is bullish, take only Buy signals (or pullback longs) on the lower timeframe; when bearish, take only Sell signals (or pullback shorts).
- Stop-loss: On the timeframe you enter (e.g. below/above the signal bar or recent swing).
- Take-profit: Logical level or trailing stop.
On 4H and daily for swing trades, I've found HalfTrend particularly useful. On shorter timeframes I sometimes increase Amplitude to 3–4 to reduce whipsaws and combine it with RSI or volume for confirmation. I haven't tested it on 1-minute charts, but I'd expect more false signals there without a filter.
Best HalfTrend Settings
Settings should match your timeframe and style. Below are practical starting points.
Scalping (1–5 minute charts)
- Amplitude: 2–3.
- Channel Deviation: 2.
- Defaults can work; slightly higher Amplitude may cut some noise.
Day trading (15–60 minute charts)
- Amplitude: 2–4.
- Channel Deviation: 2–3.
- Balances responsiveness and false flips.
Swing trading (4H–daily charts)
- Amplitude: 2–5.
- Channel Deviation: 2–3.
- Slightly higher Amplitude on daily can smooth the trend line.
Position trading (daily/weekly)
- Amplitude: 3–6.
- Channel Deviation: 2–3.
- Focus on major trend; fewer signals, higher commitment.
In general: higher Amplitude = smoother HT line and fewer signals but more lag; higher Channel Deviation = wider ATR bands and more room for pullbacks. No indicator works 100% of the time — always use stop-loss and position sizing. I prefer Amplitude 3–4 on daily charts for swing trades; the default 2 felt too responsive for my style. Don't assume one setting works on every pair — test first.
Advanced HalfTrend Techniques
Multi-timeframe analysis
Use HalfTrend on a higher timeframe for trend direction, then use the same or a slightly different HalfTrend on a lower timeframe for exact entry on the next Buy/Sell signal or pullback in the direction of the higher-timeframe trend.
Combining with other indicators
- RSI: Use RSI overbought/oversold at HalfTrend flips to filter or confirm (e.g. only take Buy when RSI was oversold).
- Volume: Require above-average volume on the signal bar for conviction.
- MACD or other trend indicators: Use HalfTrend for bias and MACD/trend for timing (e.g. MACD cross in the direction of HalfTrend).
Risk and pitfalls
- HalfTrend can whipsaw in tight ranges; consider a higher Amplitude or a filter (e.g. only trade when price is not chopping around the HT line for many bars).
- No indicator works every time; always use stop-loss and position sizing.
- On very short timeframes, you can disable or reduce Buy/Sell labels if the chart gets cluttered.
How to Backtest HalfTrend
Backtesting helps you see if your HalfTrend-based rules add value before risking capital. In the Pineify Editor you can build a strategy that uses HalfTrend in the conditions and then backtest it.
Typical strategy elements:
- Entry/exit conditions: e.g. Buy signal = long, Sell signal = short; or use HalfTrend bias (up/down) plus your own entry rule.
- Market orders: long/short when conditions are met.
- Take profit: fixed target, opposite signal, or level-based.
- Stop loss: below/above recent swing or the opposite ATR band.
- Trailing stop (optional): to lock in profits when trend extends.
Risk management:
- Risk 1–2% of capital per trade (position size so that stop distance equals 1–2% of account).
- Limit how many concurrent positions you have.
- Test on multiple symbols and timeframes to see where the edge holds.
I ran a backtest on BTCUSD daily with Amplitude 3, entry on Buy/Sell signals only, and a 2R take-profit — the win rate was around 45% but the average winner was larger than the average loser. Not earth-shattering, but enough to work with proper position sizing.
FAQs
What's the best Amplitude for HalfTrend?
Default 2 is common and works well across many timeframes. Use 2–3 for scalping and day trading, and 3–6 for swing and position trading. Higher Amplitude means a smoother line and fewer signals, but it also adds lag.
What does Channel Deviation do in HalfTrend?
It's a multiplier applied to half of the 100-period ATR. It controls how far the ATR High and ATR Low bands sit from the HalfTrend line. Default 2 is typical; higher values widen the channel and give pullbacks more room before the trend is questioned.
Can I use HalfTrend for crypto?
Yes. Crypto tends to be volatile, so HalfTrend may flip more often on default settings. A slightly higher Amplitude (3–4) on higher timeframes helps reduce noise. Always use stops and position sizing.
Why does HalfTrend use ATR(100)?
The indicator uses a 100-period ATR (and half of it) for the channel and arrow offset, so the bands adjust to recent volatility. This length is fixed in the classic formulation — you can't change the ATR length in the standard inputs, only Amplitude and Channel Deviation.
How do I avoid whipsaws with HalfTrend?
Raise the Amplitude, trade only in the direction of a higher-timeframe HalfTrend, or require a second confirmation (close beyond the HT line, or an RSI/volume filter). Low Amplitude in choppy markets doesn't help — raising it or adding a filter usually fixes the problem.
Can I combine HalfTrend with RSI or MACD?
Yes. Use HalfTrend for trend bias and Buy/Sell flips; add RSI or MACD for overbought/oversold or momentum confirmation. For example: only take a HalfTrend Buy when RSI isn't overbought, or only take a HalfTrend Sell when MACD is bearish. Keep the rules simple so backtests stay interpretable.
