AI vs Human Stock Picking: Pineify vs Motley Fool Stock Advisor
· 12 min read
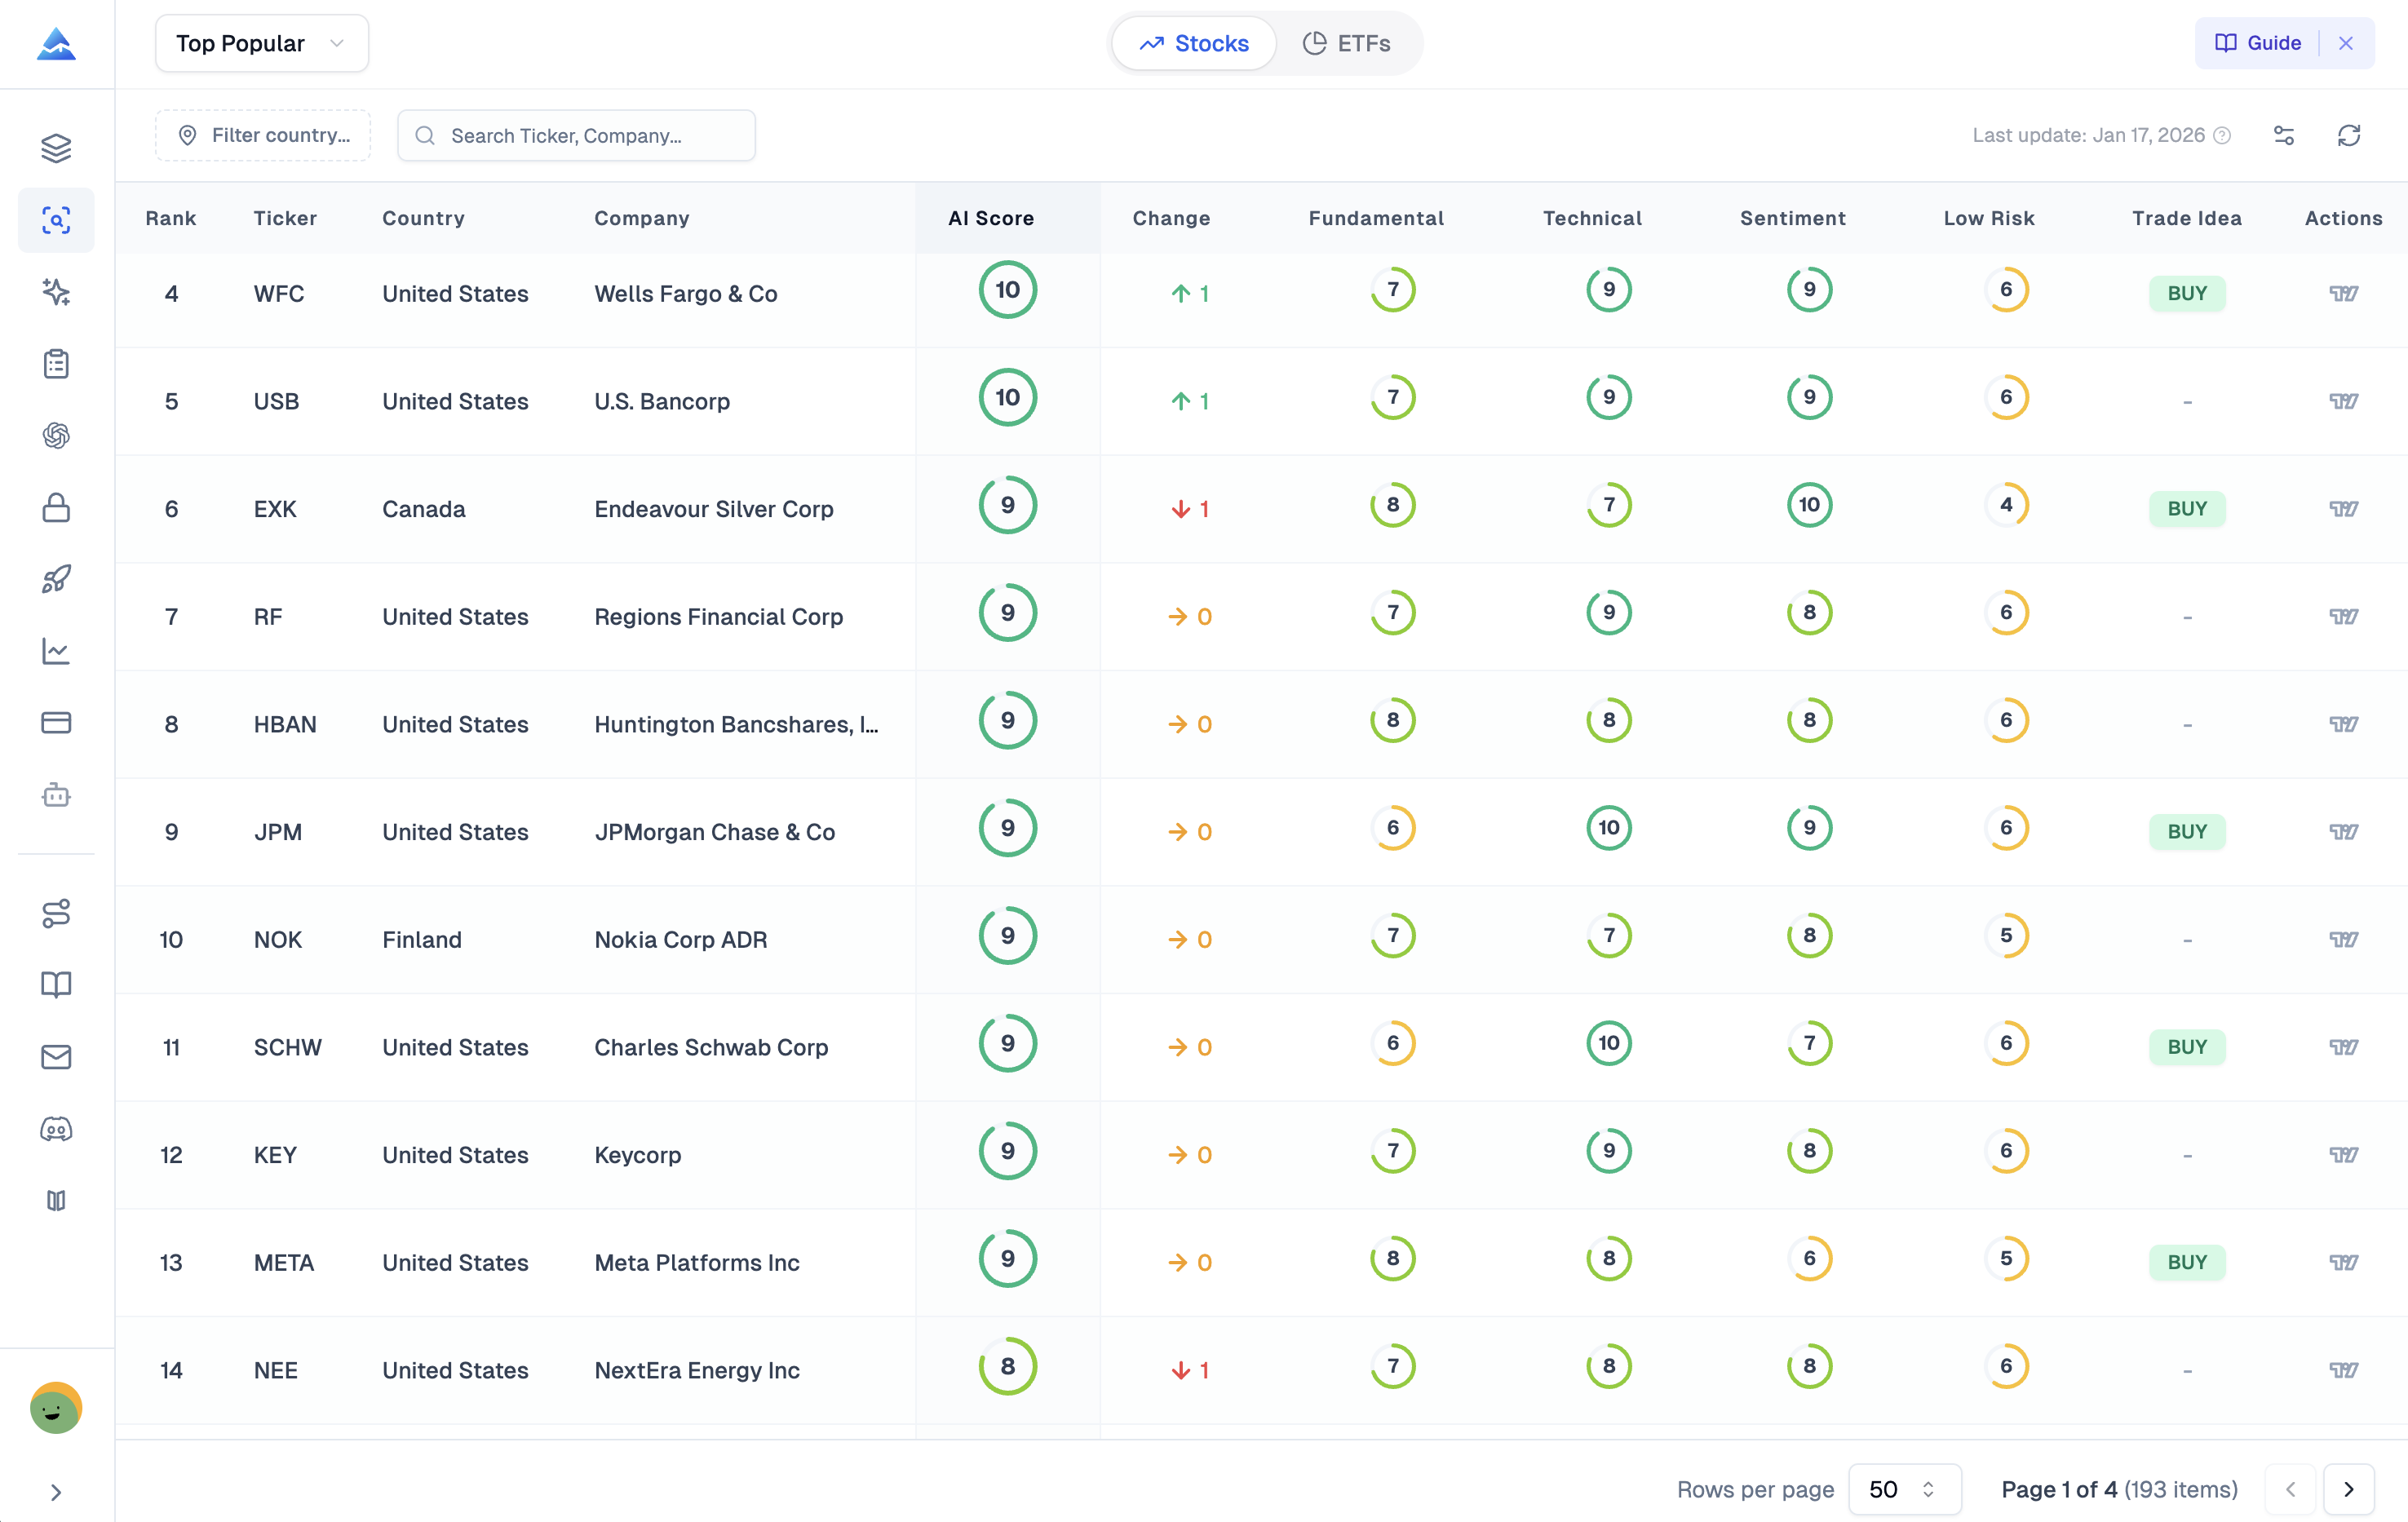
AI stock picking uses algorithms to scan and score thousands of stocks daily based on fundamentals, technicals, and sentiment. Human stock picking relies on experienced analysts who research a handful of companies each month and publish their best ideas. I've tested both Pineify's AI Stocks & Options Picker and Motley Fool Stock Advisor on real trades since early 2025. The verdict is decisive: if you trade actively or use options, Pineify wins. If you buy and hold for years, Motley Fool is the smarter call. Picking the wrong one for your style will waste your time.