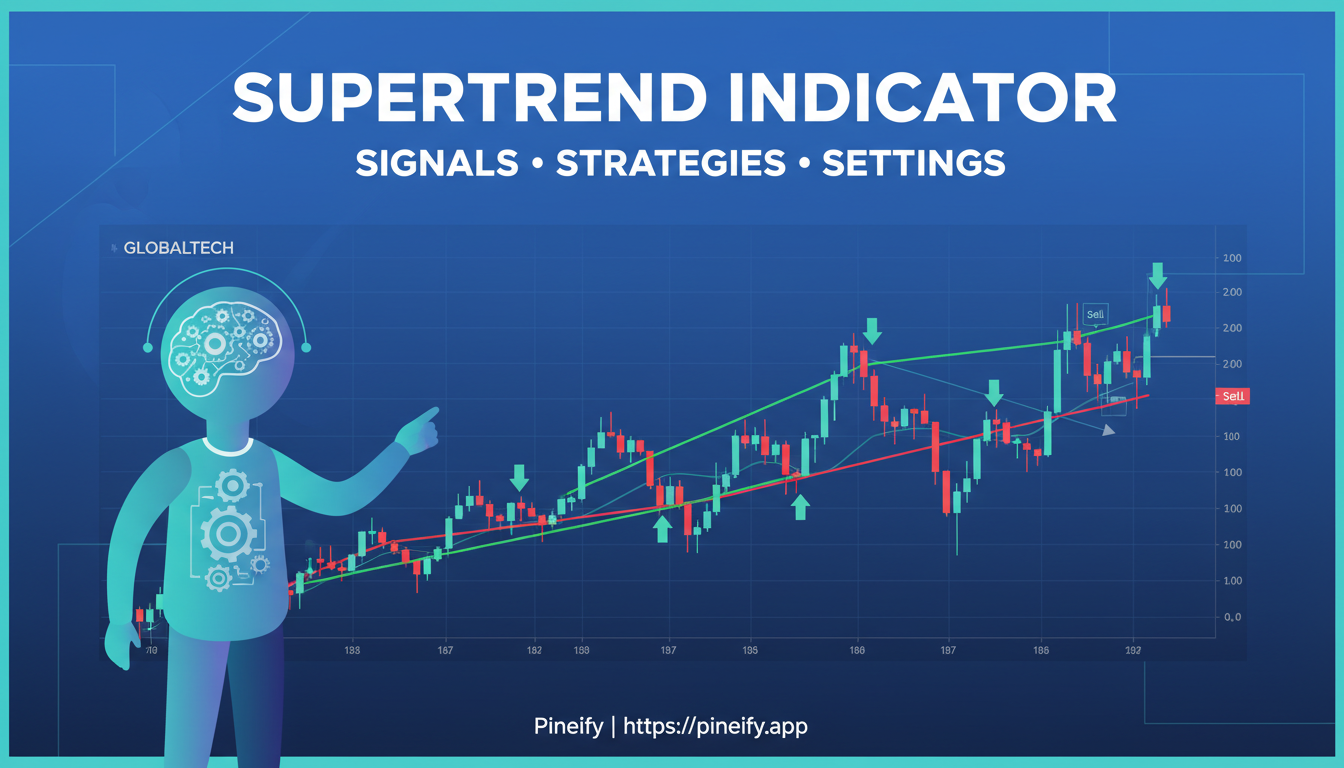
Supertrend is an ATR-based trend indicator. Its line alternates between an upper and lower trailing band as its direction changes. Those changes describe a price condition; they do not establish a profitable entry rule or a universally best setting.
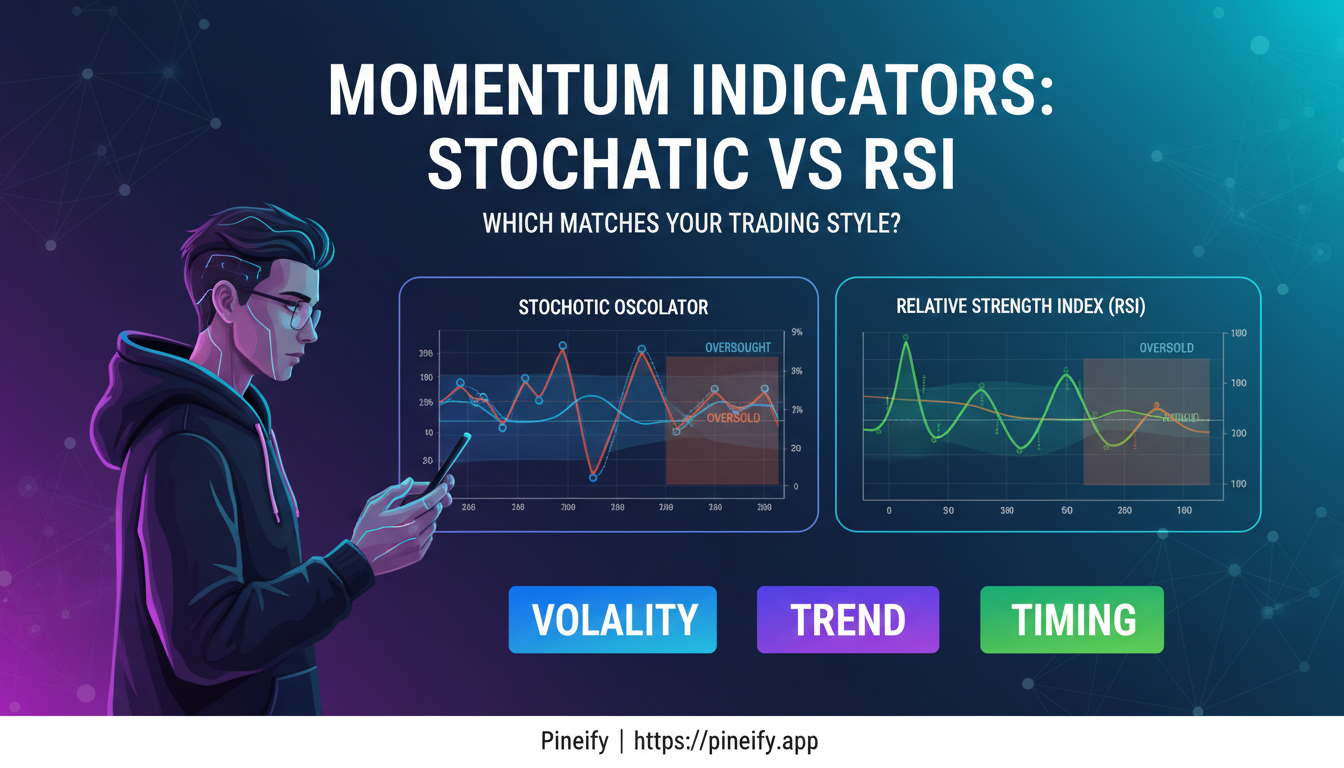
RSI and the Stochastic Oscillator answer different questions about the same price history. RSI compares smoothed gains and losses. Stochastic measures the close's location within a recent high/low range, often with additional smoothing. Neither definition proves that one is best for trending markets, ranges, or day trading.
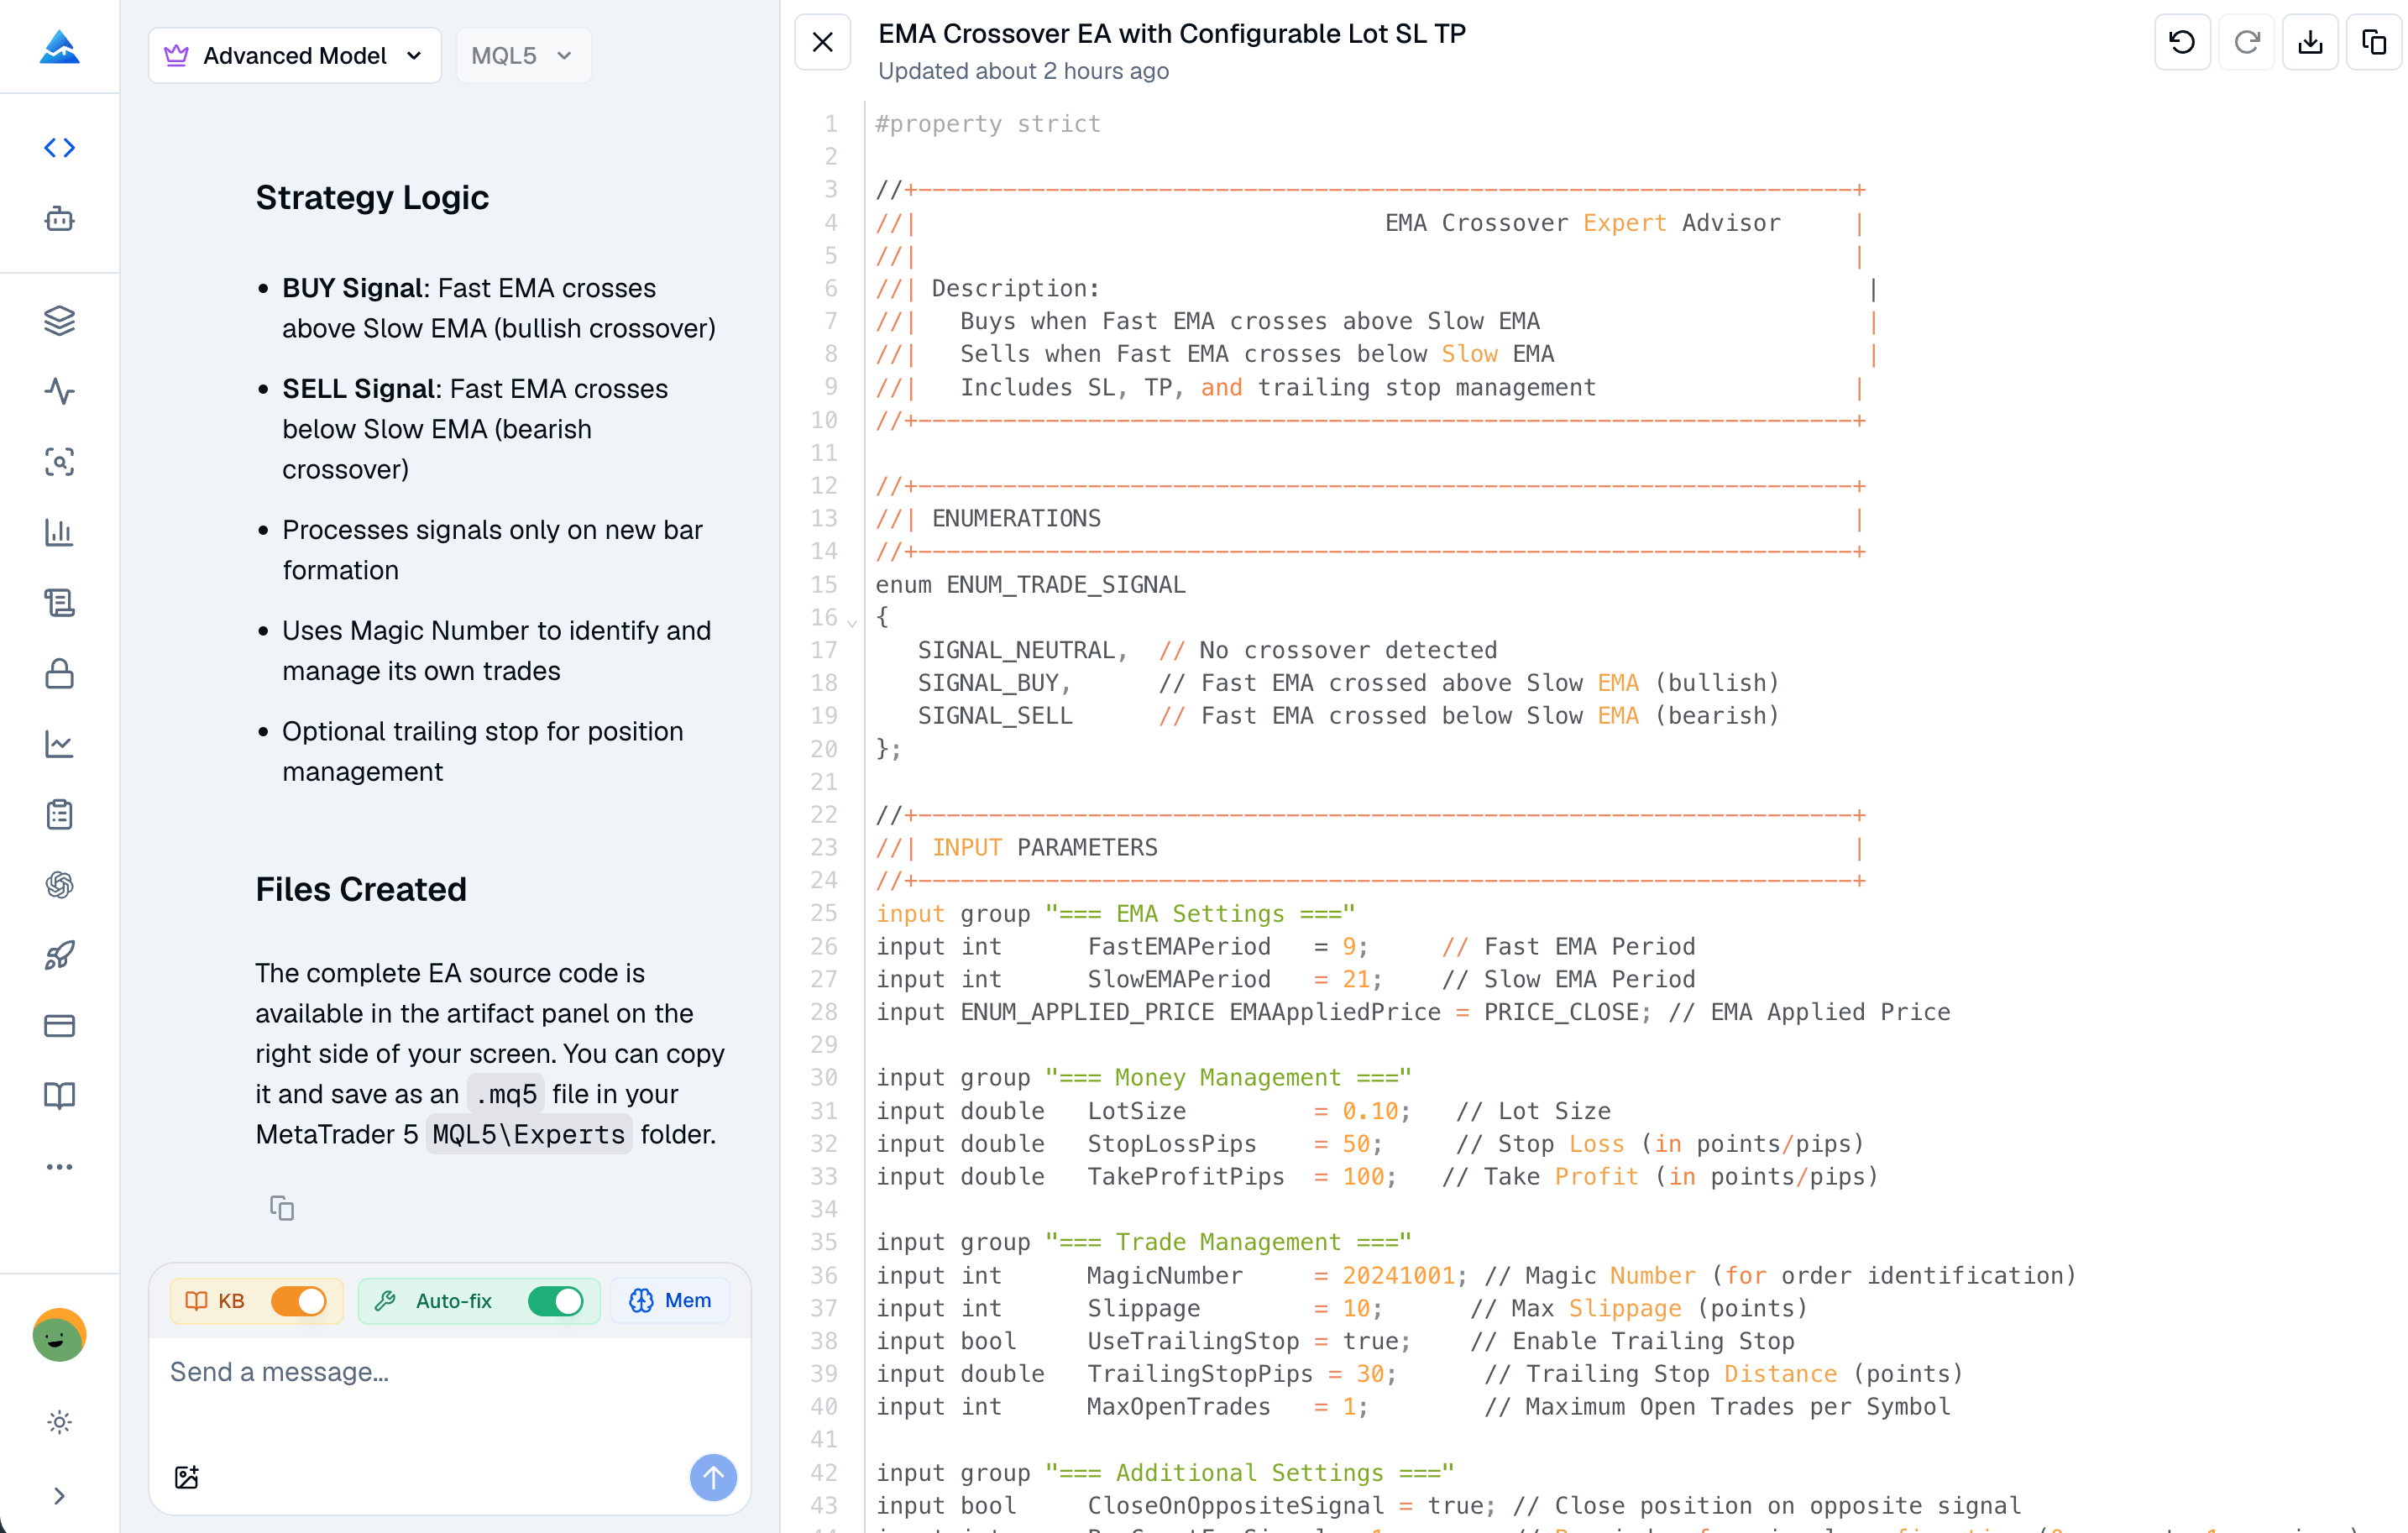
The best AI for an MQL5 project is the one whose output you can inspect, compile, and test against a precise trading specification. Pineify offers an MQL5 coding workflow, general assistants can draft MQL5, and MetaEditor has its own AI Assistant. No reproducible benchmark presented here establishes a first-compile success rate or an accuracy winner.
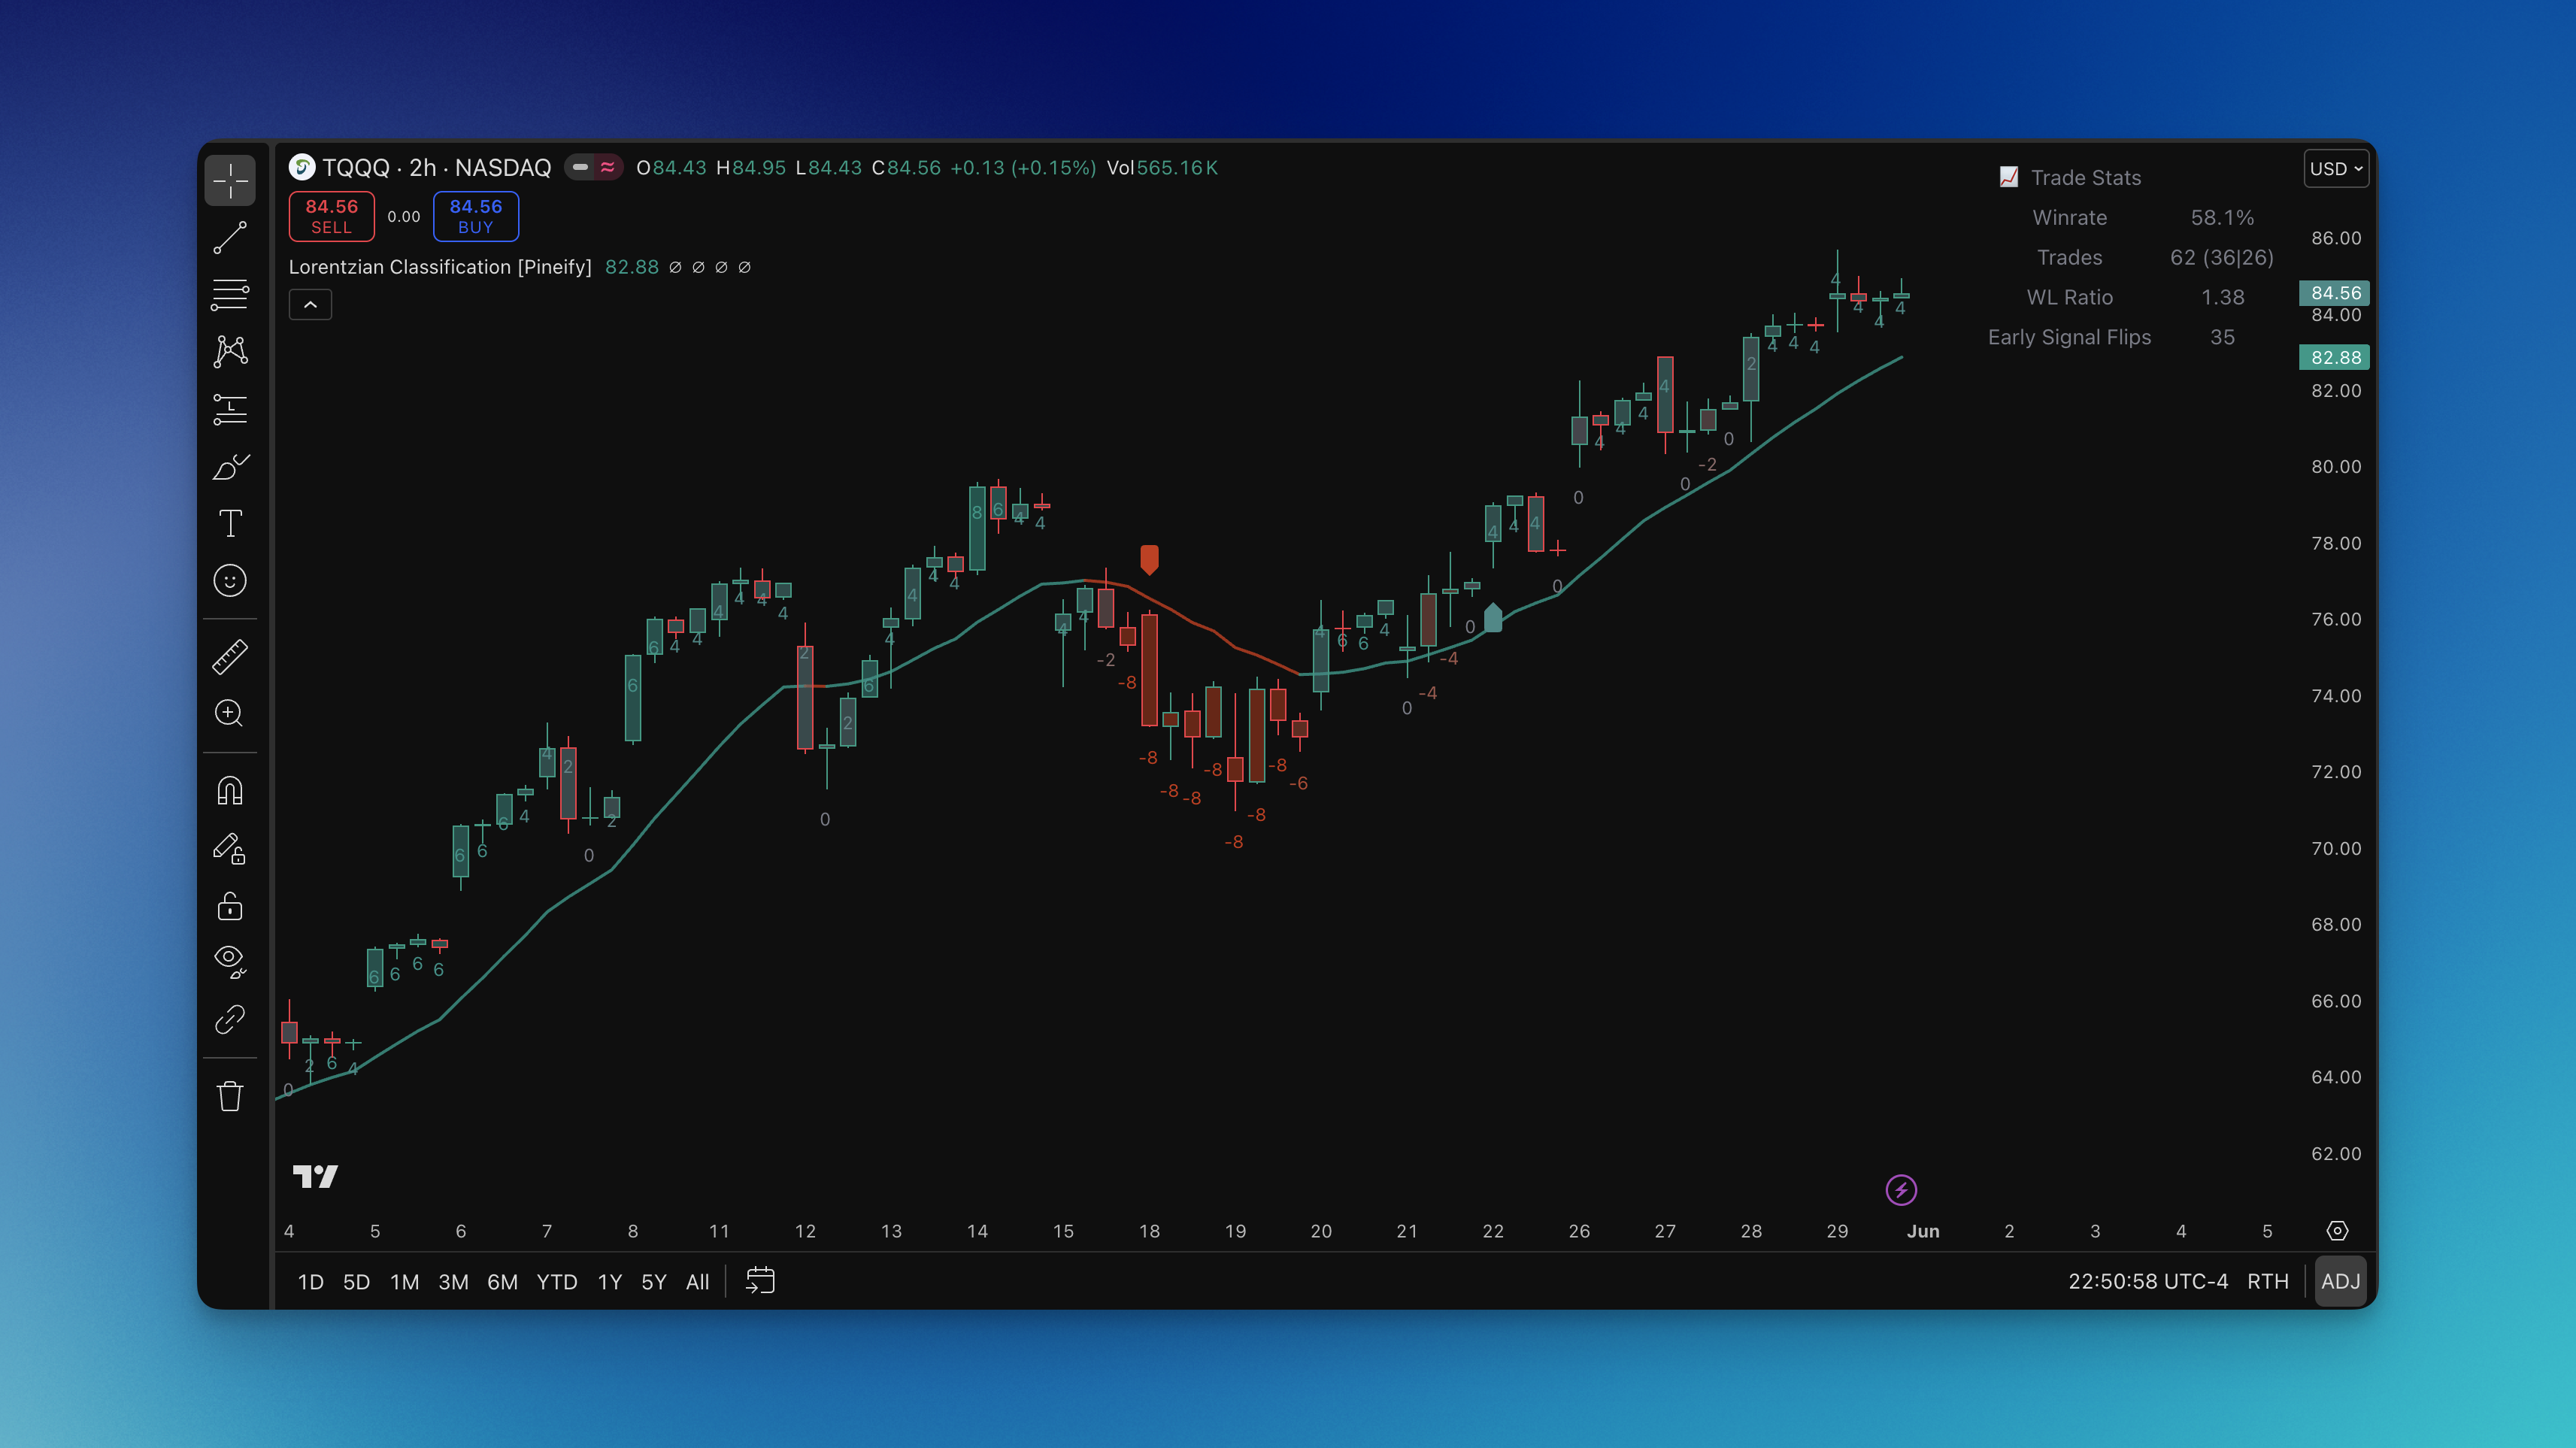
Lorentzian Classification combines technical features, a logarithmic distance calculation, stateful vote selection, filters, and kernel regression. Its “prediction” output is a model score, not a calibrated probability or an independently verified trading advantage. This guide describes the current Pineify component and the checks needed before interpreting its labels.
A squeeze indicator compares volatility envelopes and may display a separate momentum histogram. The squeeze state describes a relationship between those envelopes. It does not guarantee an explosive move, predict its direction, or establish that a longer squeeze will produce a larger return.
For MQL5, choose an AI tool by the development workflow it supports: editable source, access to the right API documentation, compiler feedback, and a way to inspect the resulting trades. A model name or a promise of "zero errors" cannot establish that an Expert Advisor implements your rules.
This is a Pineify-published comparison of documented capabilities. We have no reproducible head-to-head benchmark establishing a winning model, first-pass compilation rate, or fastest development time.
AlgoAlpha publishes free and paid TradingView indicators, plus strategy research and testing tools. This guide explains the documented workflows and the checks needed before treating a chart signal as a trading rule. It is a documentation review, not a record of live trading or a performance comparison with other indicators.
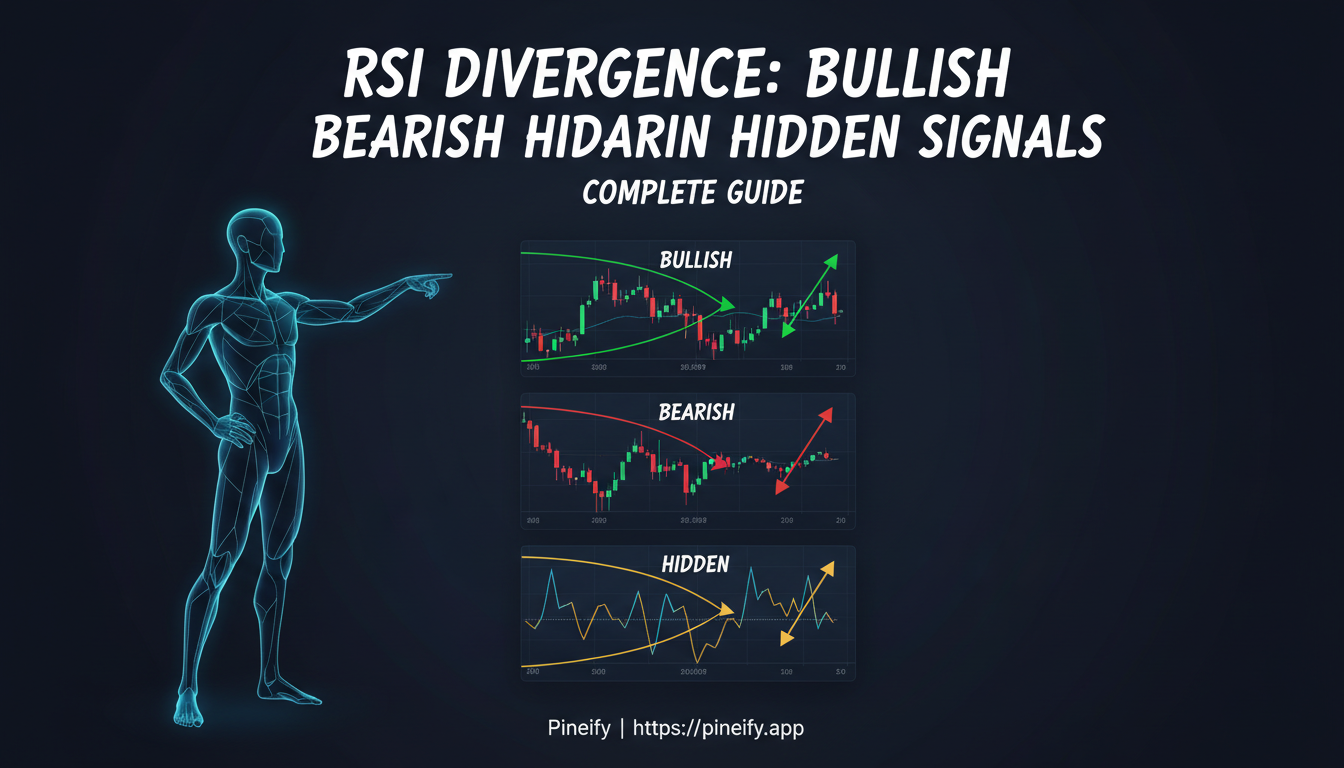
RSI divergence compares the direction of selected price swings with selected RSI swings. It describes a disagreement between those series. Whether that disagreement predicts a useful trade depends on the pivot rule, timing, exits, costs, and data used to evaluate it.
AlgoPro offers TradingView indicators and associated strategy analysis, optimization and automation tools. Whether the package is useful depends on the exact workflow you need and the terms available at checkout. This review examines public product information; it does not claim hands-on trading results, an independent repaint test or verified customer satisfaction scores.
TradingView's built-in All Chart Patterns indicator draws supported price formations on the current chart. It can reduce manual drawing work, but a detected shape is not a verified trading edge. This guide covers the built-in tool; community scripts with similar names can use different algorithms, settings and access terms.