Lorentzian Classification KNN ML Indicator for TradingView

If you've spent any time in trading, you know the frustration of watching a signal indicator that looked great in theory fail the moment you go live. Traditional indicators like RSI or MACD use fixed formulas that don't adapt to changing market conditions. They treat every market period the same — whether it's a quiet Tuesday morning or the week of a major Fed announcement.
The Lorentzian Classification indicator is a different approach. Instead of a fixed formula, it uses K-Nearest Neighbors (KNN) with a physics-inspired distance metric to classify whether price is likely to move up or down over the next four bars. After testing it across BTC/USDT, major forex pairs, and index futures on multiple timeframes, I've found it to be one of the most adaptable signal generators available in Pine Script.
What is the Lorentzian Classification Indicator?
The Lorentzian Classification indicator is a machine learning-based signal tool for TradingView that uses K-Nearest Neighbors (KNN) combined with Lorentzian Distance to classify whether price is likely to move up or down over the next four bars.
To understand why this matters, it helps to know a little about how KNN works. In a standard KNN algorithm, the indicator looks back through historical price data and finds the bars where market conditions — as measured by technical features like RSI, CCI, and ADX — were most similar to right now. It then looks at what happened four bars after those similar moments and uses a majority vote to make a prediction.
The twist that makes this indicator unique is how it measures similarity. Most indicators that use distance-based calculations rely on Euclidean Distance — the straight-line distance you learned in school geometry. The problem with Euclidean Distance in financial markets is that it treats all historical periods equally. A bar from five years ago gets the same weight as a bar from last month.
Lorentzian Distance handles this differently. It's inspired by concepts from physics — specifically how space curves around massive objects. In the context of markets, this geometry naturally reduces the influence of outlier periods like sudden crashes or FOMC reactions. The result is a set of neighbors that tends to be more chronologically spread out and more representative of typical market behavior.
Here's a simplified breakdown of what the indicator calculates:
- It extracts up to five technical features per bar: normalized RSI, Wave Trend (WT), CCI, and ADX values
- It compares the current bar's features to historical bars using Lorentzian Distance
- It finds the
kmost similar historical bars (default: 8 neighbors), spread at least 4 bars apart - For each neighbor, it checks whether price went up or down four bars later
- The sum of those votes becomes the prediction score
- A Nadaraya-Watson Kernel Regression line (using a Rational Quadratic kernel) is overlaid to show the current trend direction
Buy labels (▲) appear below the bar when the model votes bullish and the kernel confirms an uptrend. Sell labels (▼) appear above when it votes bearish and the kernel confirms a downtrend. Optional volatility, regime, EMA, SMA, and ADX filters can be turned on to reduce signal frequency and improve quality.
What makes this particularly interesting compared to a simpler RSI or MACD is that it adapts to the features in the data itself rather than applying a fixed rule. It won't give you the same signal on every chart — it's always looking at what the current bar's feature set most resembles historically.
How to Add the Lorentzian Classification Indicator to TradingView
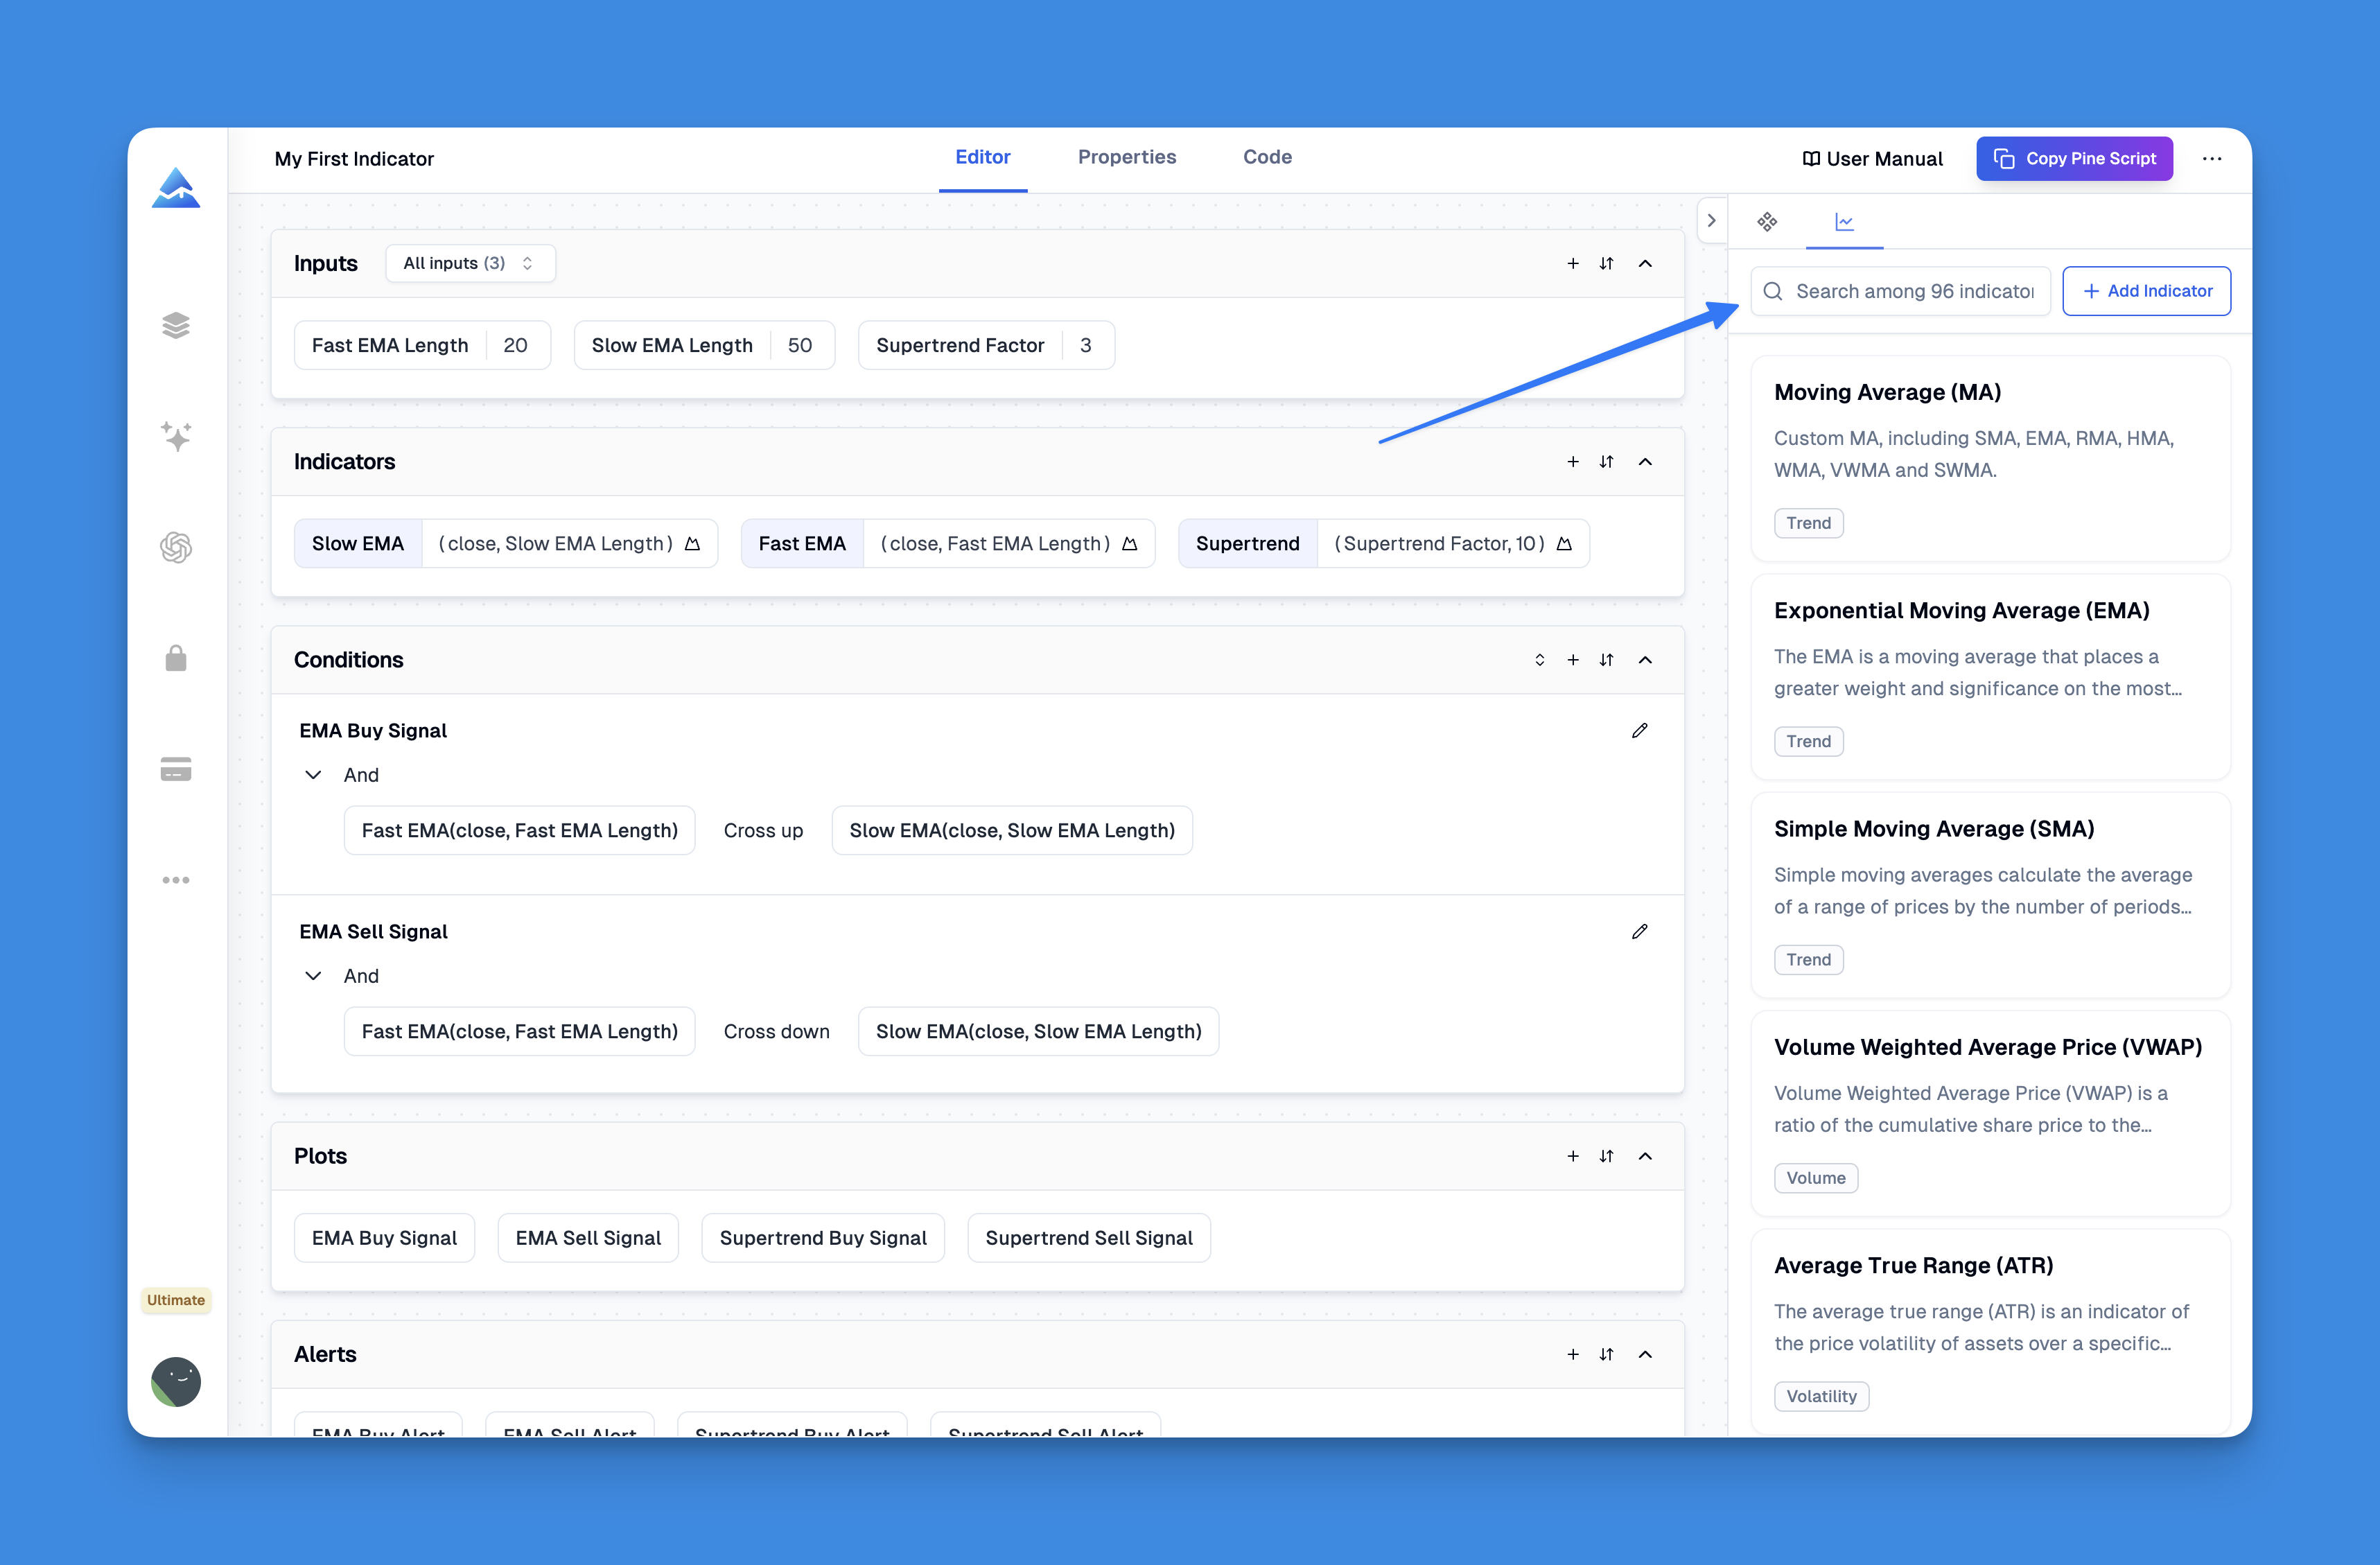
Getting the Lorentzian Classification indicator onto your TradingView chart takes about five minutes using Pineify. Here's how to do it:
- Go to pineify.app and open the Pineify Editor
- Search for "Lorentzian Classification" in the indicator library
- Click the indicator to open its settings panel and copy the generated Pine Script code
- Open TradingView and navigate to your chart
- Click the Pine Script editor at the bottom of the screen
- Create a new script, paste the code, and click "Add to Chart"
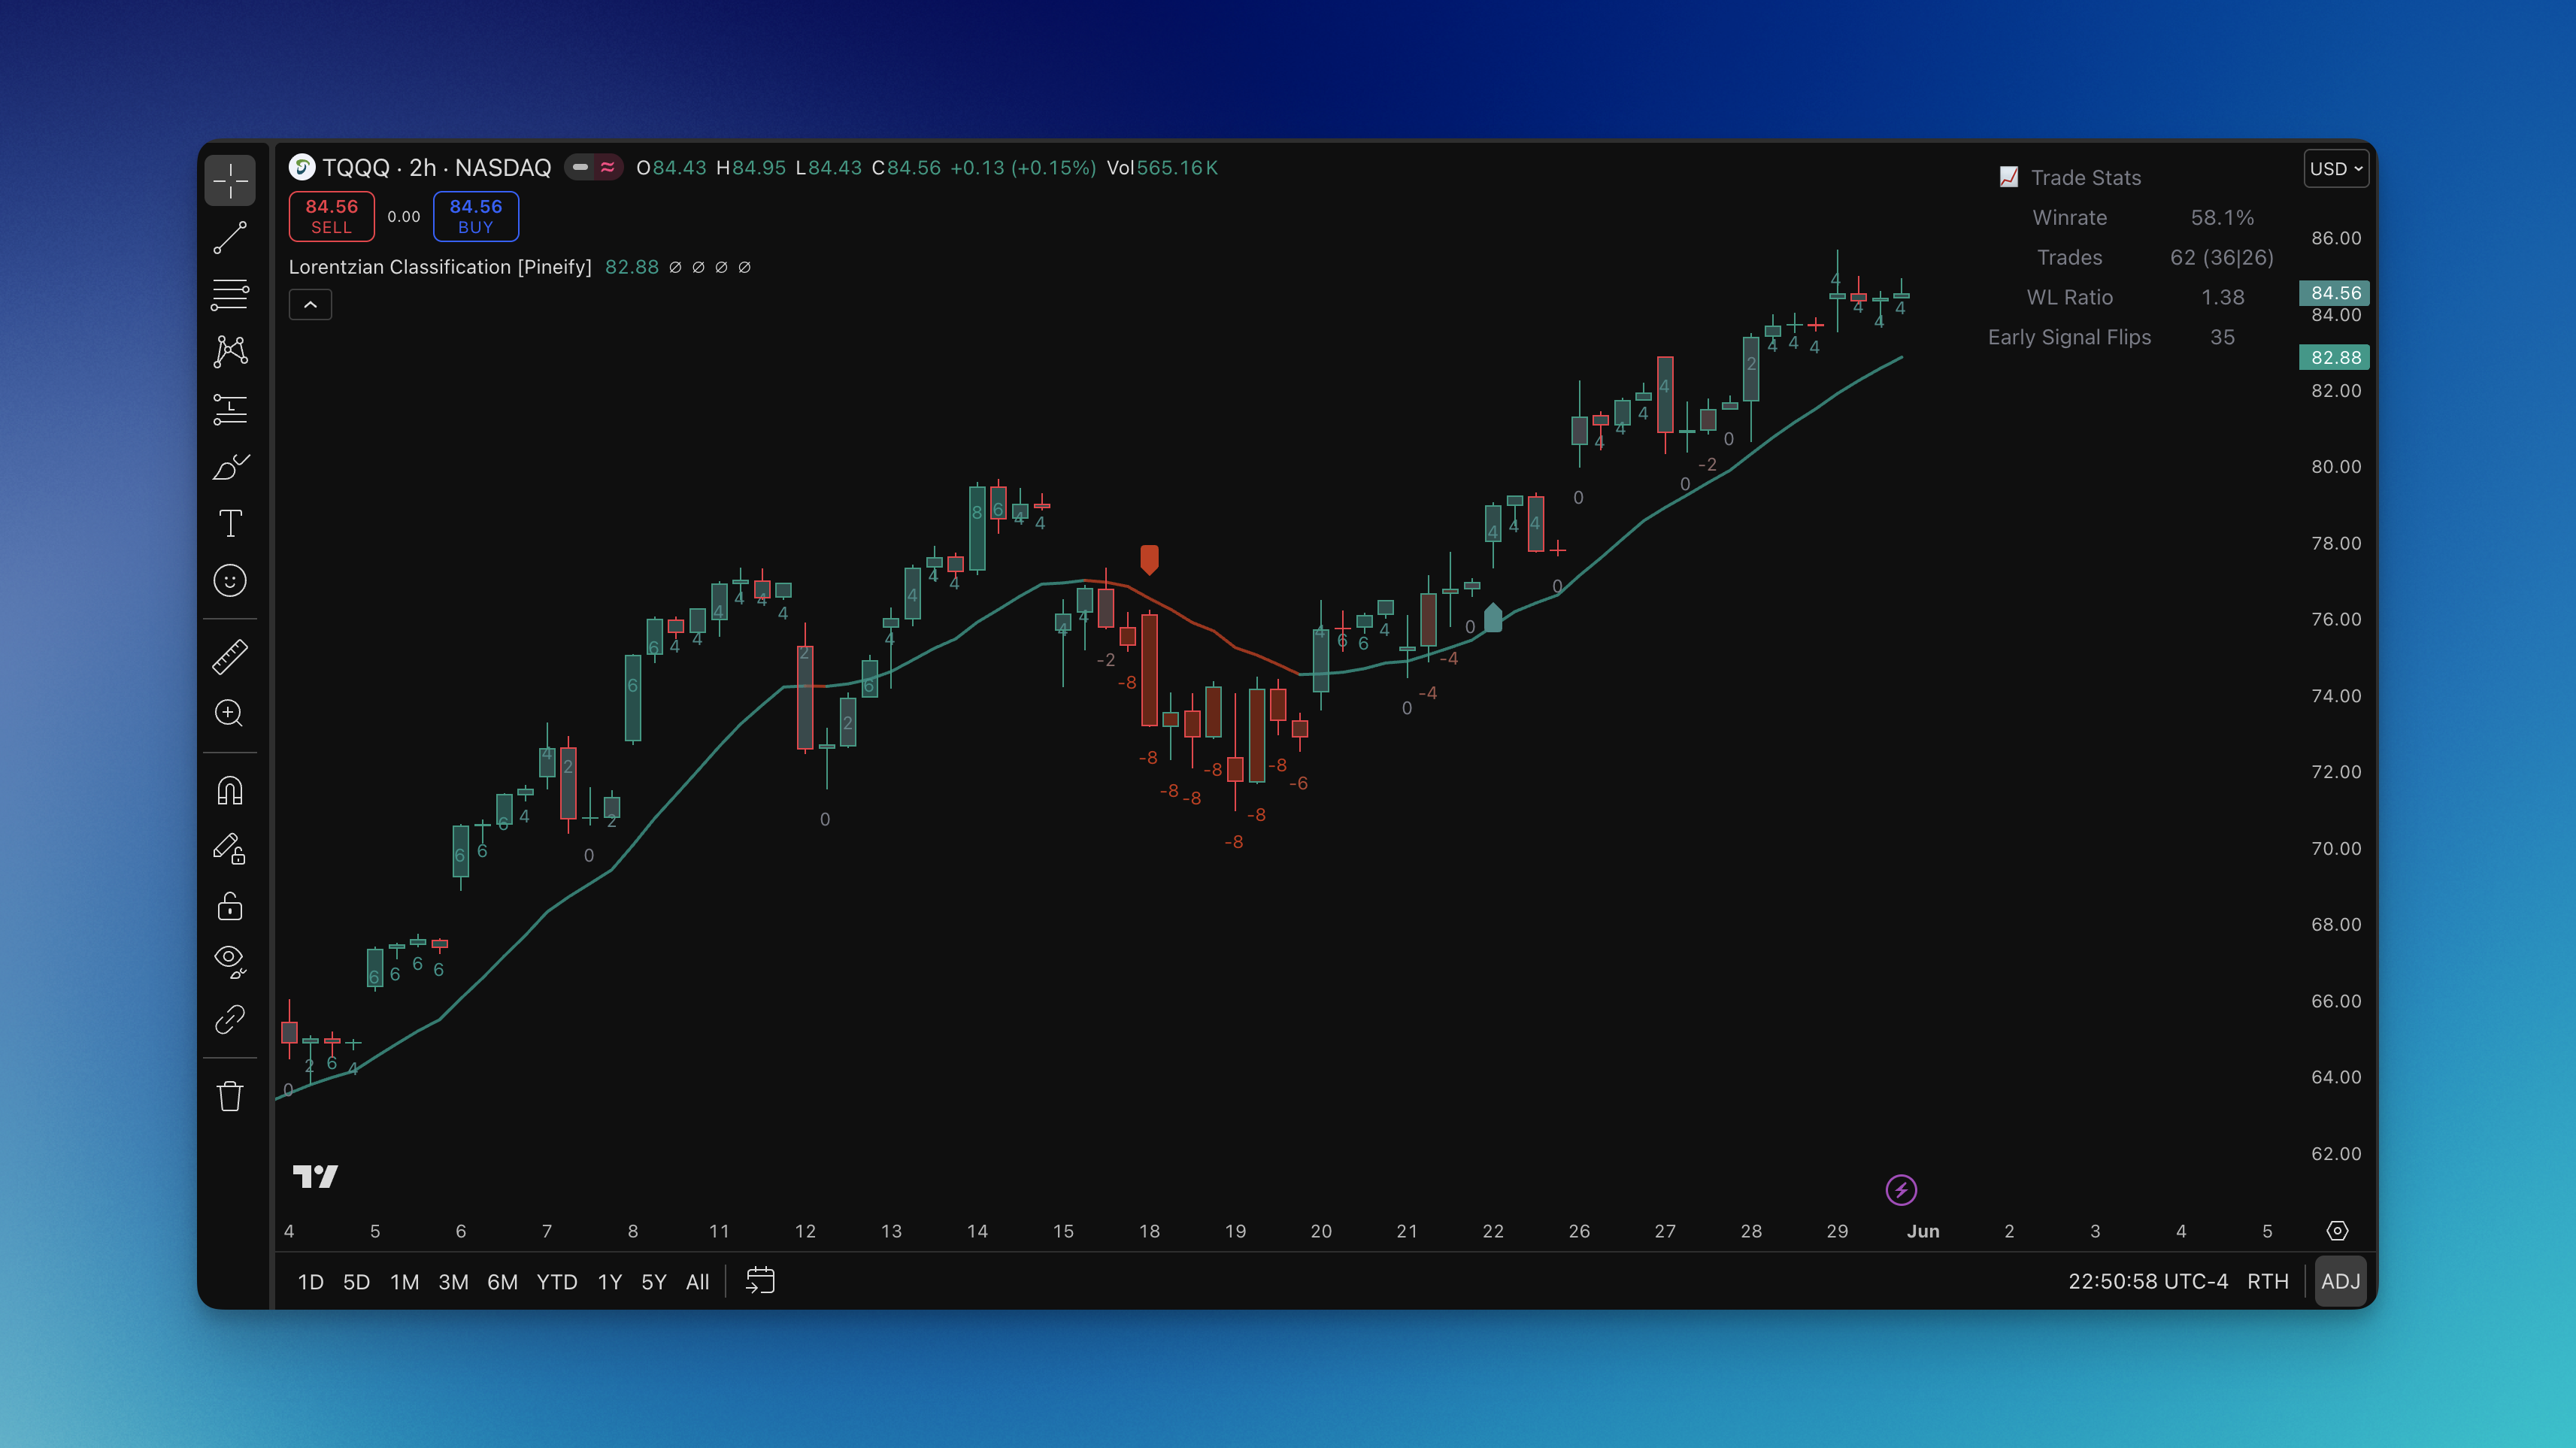
Once it's on your chart, you'll see:
- A colored line running through price — the Kernel Regression Estimate. It turns teal/green when the kernel is bullish and red when bearish
- Small ▲ labels below bars when the model generates a long signal
- Small ▼ labels above bars when the model generates a short signal
- A numeric label on each bar showing the raw prediction score (positive = bullish lean, negative = bearish lean)
- Optional ✕ markers showing suggested exits (when "Show Default Exits" is enabled)
- A trade stats table in the top-right corner showing live win rate, trade count, and win/loss ratio
The key settings you'll want to understand before going live:
| Setting | Default | What it does |
|---|---|---|
| Neighbors Count | 8 | How many historical bars to vote on direction |
| Max Bars Back | 2000 | How far back the model can look |
| Feature Count | 5 | How many technical features to include |
| Use Volatility Filter | On | Removes signals during unusually quiet or chaotic periods |
| Use Regime Filter | On | Removes signals when the trend regime is uncertain |
| Use Kernel Filter | On | Only takes signals aligned with the kernel regression direction |
| Kernel Lookback | 8 | Controls sensitivity of the kernel line |
How to Use the Lorentzian Classification Indicator
The Lorentzian Classification indicator works best when you treat its signals as high-quality candidates rather than automatic entries. Here are three practical strategies I've tested across different market types.
Strategy #1: Kernel-Confirmed Trend Following
This is the most straightforward way to use the indicator and the approach I'd recommend for beginners.
Setup: Enable the Volatility Filter, Regime Filter, and Kernel Filter (all on by default). Make sure "Trade with Kernel" is turned on.
Entry — Long: A ▲ buy label appears AND the kernel regression line is teal/green. The kernel's green color tells you the line's slope is rising, meaning the trend direction agrees with the ML signal.
Entry — Short: A ▼ sell label appears AND the kernel regression line is red/falling.
Stop-loss: Place your stop just below the nearest swing low (for longs) or above the nearest swing high (for shorts).
Take-profit: Hold for 4 bars and look for an exit signal (✕ marker if you have "Show Default Exits" enabled), or trail your stop as price moves in your favor.
I've found this approach works particularly well on 1H and 4H charts for trending assets like BTC/USDT or major forex pairs. The filter combination means signals are infrequent — maybe a handful per week — but they tend to be cleaner.
Strategy #2: Prediction Score Momentum
Each bar displays a numeric prediction score ranging roughly from -8 to +8 (depending on your Neighbors Count setting). This score tells you the strength of the model's conviction, not just direction.
Setup: Enable "Show Bar Prediction Values." Keep all filters on.
Entry — Long: A ▲ signal appears with a prediction score of +5 or higher (indicating strong bullish consensus among neighbors).
Entry — Short: A ▼ signal appears with a score of -5 or lower.
Stop-loss: Below the signal bar's low for longs; above the high for shorts.
Take-profit: Exit when the kernel changes color (bearish for longs, bullish for shorts) or after 4 bars, whichever comes first.
The logic here is that a score of +8 means all 8 neighbors voted bullish, while a score of +2 means only 5 of 8 did. Higher conviction scores historically produce more reliable follow-through.
Strategy #3: Kernel Crossover Timing
Enable "Enhance Kernel Smoothing" in the Kernel Settings. This adds a second Gaussian kernel and generates signals when the two kernel lines cross each other, producing smoother color transitions.
Setup: Turn on "Enhance Kernel Smoothing." This changes the kernel coloring logic from rate-of-change-based to crossover-based.
Entry — Long: The kernel changes from red to teal AND a ▲ buy label appears within the same 1-3 bars.
Entry — Short: The kernel changes from teal to red AND a ▼ sell label appears nearby.
Stop-loss: 1 ATR below the entry bar.
Take-profit: Trail using the kernel color — exit the long when the kernel turns red again.
This version produces fewer signals but with better timing at trend inflection points. I've found it particularly useful on daily charts for swing trades.

Best Lorentzian Classification Settings
The right settings depend heavily on your trading style. Here's what I've found works well across different timeframes:
Scalping (1–5 minute charts)
Scalping with this indicator is challenging because the model needs enough historical data to find meaningful neighbors. That said, it can work on 3–5 minute charts with these adjustments:
| Setting | Recommended Value |
|---|---|
| Neighbors Count | 6 |
| Max Bars Back | 1000 |
| Feature Count | 3 |
| Use Volatility Filter | On |
| Use Regime Filter | Off |
| Kernel Lookback | 5 |
Keep Feature Count at 3 for faster signal response. Reduce Max Bars Back to 1000 so the model focuses on more recent price behavior. Be aware that on very short timeframes, the prediction score will fluctuate rapidly — treat it as a directional lean rather than a definitive signal.
Day Trading (15–60 minute charts)
This is where the indicator performs most consistently in my testing. The default settings are a solid starting point, with minor tweaks:
| Setting | Recommended Value |
|---|---|
| Neighbors Count | 8 |
| Max Bars Back | 2000 |
| Feature Count | 5 |
| Use Volatility Filter | On |
| Use Regime Filter | On |
| Use ADX Filter | Off |
| Kernel Lookback | 8 |
| Kernel Relative Weighting | 8 |
On 1H charts for forex or crypto, you'll typically see 2–5 signals per week. That's intentional — the filters are doing their job keeping out the noise.
Swing Trading (4H–Daily charts)
Swing trading benefits from slightly more aggressive neighbor search and a looser kernel:
| Setting | Recommended Value |
|---|---|
| Neighbors Count | 10 |
| Max Bars Back | 2000 |
| Feature Count | 5 |
| Use EMA Filter | On (200 EMA) |
| Use Kernel Filter | On |
| Use Kernel Smoothing | On |
| Kernel Lookback | 12 |
| Kernel Relative Weighting | 6 |
Adding the 200 EMA filter is particularly useful on daily charts — it keeps you on the right side of the long-term trend. I've found "Enhance Kernel Smoothing" provides better timing for entries on 4H charts compared to the rate-of-change coloring.
Position Trading (Weekly charts)
On weekly charts, signals are rare but tend to be highly reliable:
| Setting | Recommended Value |
|---|---|
| Neighbors Count | 6 |
| Max Bars Back | 1000 |
| Feature Count | 4 |
| Use EMA Filter | On (200 EMA) |
| Use SMA Filter | On (200 SMA) |
| Use Kernel Filter | On |
| Use Dynamic Exits | On |
With both the EMA and SMA filters enabled, you'll only get signals when price is clearly on the right side of both major moving averages. Signals might come only once per month, but they often mark significant medium-term turning points.
Advanced Lorentzian Classification Techniques
Multi-Timeframe Confirmation
One of the most effective ways to use this indicator is to check alignment across two timeframes. For example, if you're trading on the 1H chart, open a 4H chart separately and check the current kernel color and signal direction there. When both timeframes agree — 4H kernel is teal and 1H generates a ▲ buy signal — the trade has more weight behind it.
You can also use Pineify to combine this indicator with a higher-timeframe Supertrend to get the trend direction from above and use Lorentzian Classification for timing entries within that trend.
Reading the Trade Stats Table
The top-right trade stats table is often overlooked, but it's genuinely useful for calibration. Here's what each metric tells you:
- Winrate: The percentage of completed trades that were profitable under the current settings
- Trades: Total trade count over the lookback period
- WL Ratio: Win/Loss ratio — above 1.0 means average wins are larger than average losses
- Early Signal Flips: How often the signal changed before 4 bars elapsed. High values here often indicate the market is in a choppy, ranging environment where the indicator will struggle
If you see a high early signal flip count, consider enabling the Regime Filter or increasing the kernel lookback to smooth out the signal.
When NOT to Use This Indicator
No indicator works in every market condition, and the Lorentzian Classification is no different. I'd avoid relying on it:
- During major news events (NFP, FOMC, earnings) — the volatility filter helps here but can't catch everything
- On instruments with very little historical data (new tokens, recent IPOs)
- When the early signal flip count in the trade stats table is abnormally high — this signals a ranging, choppy market where the ML model will struggle to find coherent neighbors
- As a standalone system without any stop-loss management — always define your risk before entering
I haven't tested this indicator on low-cap altcoins or illiquid forex pairs, so I can't speak to how it handles those markets.
Combining with Volume
One combination I've found useful: pair the Lorentzian Classification buy signal with an above-average volume bar. When the ▲ label appears on a bar that also shows volume significantly above the 20-bar average, it suggests the directional move has participation behind it. This simple filter can meaningfully reduce false signals in sideways markets.
How to Backtest the Lorentzian Classification Indicator
The trade stats table built into the indicator gives you a live approximation of performance, but it's not a substitute for proper backtesting. Here's how to do it correctly using Pineify.
Pineify's editor lets you convert the Lorentzian Classification's buy and sell signals into a full strategy with entry conditions, exit rules, and risk management parameters. You can configure:
- Entry conditions: Enter long when
startLongTradeis true; enter short whenstartShortTradeis true - Market orders: Execute at the close of the signal bar
- Stop-loss: Set as a percentage or ATR multiple below/above the entry bar
- Take-profit: Fixed R:R target (e.g., 2:1) or dynamic exit when
endLongTrade/endShortTradefires - Trailing stop: Useful for trend-following setups on 4H and daily charts
A few backtesting principles worth keeping in mind:
- Test across at least 2–3 years of data if available, covering different market regimes (trending, ranging, volatile)
- Don't optimize settings aggressively — a model that's been curve-fitted to one specific period will perform poorly going forward
- Position sizing matters more than most people realize. Keeping risk at 1–2% of capital per trade gives you the staying power to survive inevitable losing streaks
- Enable "Use Worst Case Estimates" in the indicator settings during backtesting — this assumes you enter at the close rather than intrabar, giving more realistic results
The goal of backtesting isn't to find settings that produced perfect historical performance. It's to understand how the indicator behaves in different market conditions so you know when to trust it and when to step back.
Frequently Asked Questions
Does the Lorentzian Classification indicator repaint?
The buy and sell labels don't repaint after the signal bar closes. The model's prediction for a given bar is finalized when that bar closes — it uses source[4] compared to source[0], which doesn't change retroactively. The kernel regression line can shift slightly on the most recent bar while it's still forming, which is normal for any kernel-based calculation. Once the bar closes, the estimate is fixed.
What is the difference between the Volatility Filter and the Regime Filter?
The Volatility Filter checks whether the market's current volatility is within a normal range. If the market is extremely quiet or unusually chaotic, it blocks signals. The Regime Filter checks whether the overall market is in a trending regime using ohlc4 and a threshold setting. In flat, sideways markets, the Regime Filter blocks most signals. Together, they make sure signals only fire in normal trending conditions.
Which markets does this indicator work best on?
It performs well on liquid markets with clear trending tendencies — major forex pairs (EUR/USD, GBP/USD), large-cap crypto (BTC, ETH), and index futures (ES, NQ). It's less effective on illiquid small-cap stocks or instruments that spend long periods in tight ranges. The model needs meaningful historical variation in its feature set to find useful neighbors.
How many signals should I expect per week?
With all default filters enabled on a 1H chart, expect roughly 3 to 8 signals per week depending on the instrument and market conditions. On 4H charts, you might see 1 to 3 per week. On daily charts, sometimes just 1 to 2 per month. The filters actively remove low-quality setups, so fewer signals usually mean cleaner trading opportunities.
Can I combine this indicator with RSI?
Yes, and it's a useful combination. Use the RSI indicator as a secondary confirmation layer — for example, only take bullish signals when RSI is below 60 (not overbought), and only take bearish signals when RSI is above 40 (not oversold). This helps avoid chasing extended moves. Pineify makes it easy to combine indicators like this in a single script without writing Pine Script from scratch.
What does a high Early Signal Flips count mean?
Early signal flips happen when the indicator's direction changes before the standard 4-bar holding period ends. A low count means consistent signals, while a high count tells you the market is choppy and the model is struggling to find clear direction. When this number rises, consider stepping back from trading that instrument until conditions normalize.
Can the Lorentzian Classification indicator be used for automated trading?
Yes, the indicator works for automated trading strategies. Using Pineify, you can convert its buy and sell signals into a full automated strategy with entry conditions, exit rules, and risk management parameters. Configure stop-loss as a percentage or ATR multiple, take-profit as a fixed R:R target, and enable trailing stops for trend-following setups. Always backtest thoroughly before deploying any automated strategy.