How to Overlay Two Charts in TradingView for Correlation Analysis

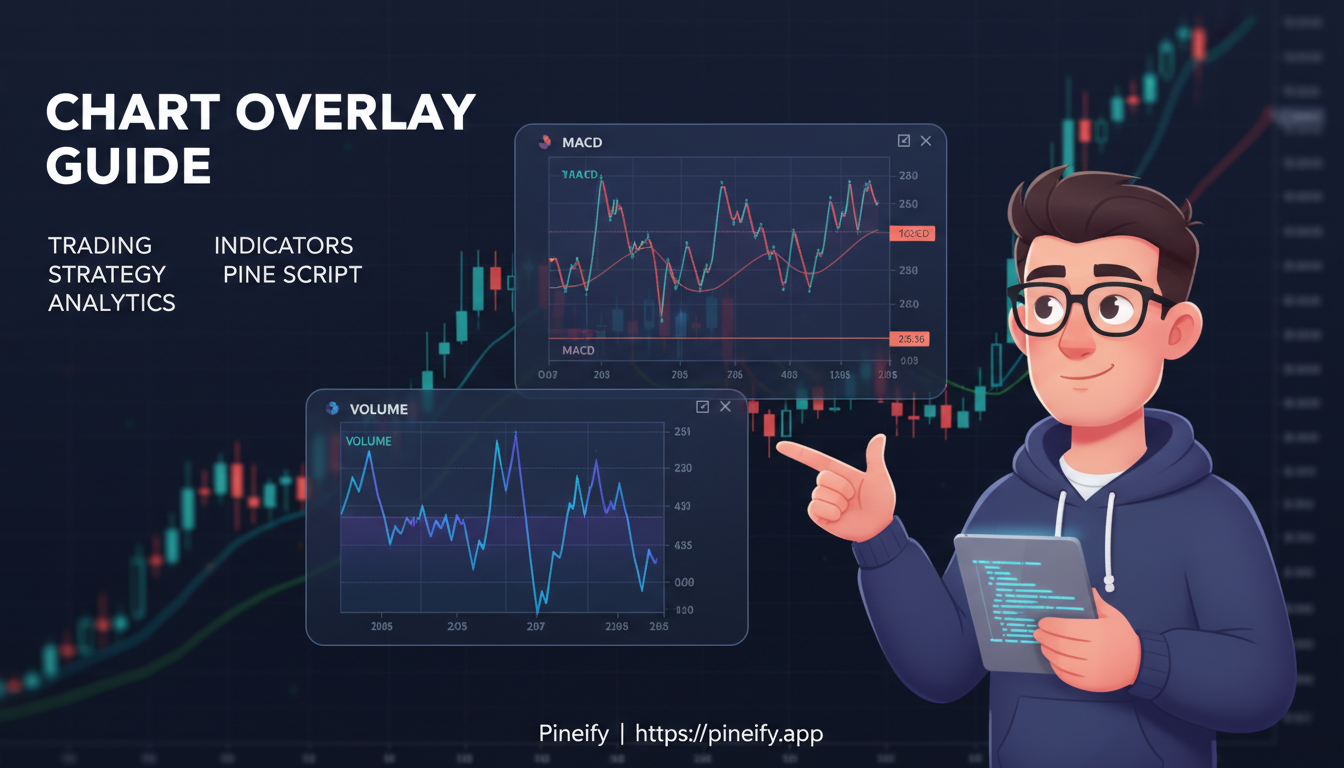
Every time I open a new TradingView chart, I'm looking for relationships. Which asset is leading, which is lagging, and where the divergence might signal a trade. Flipping between tabs wastes time and buries patterns. A chart overlay solves that.
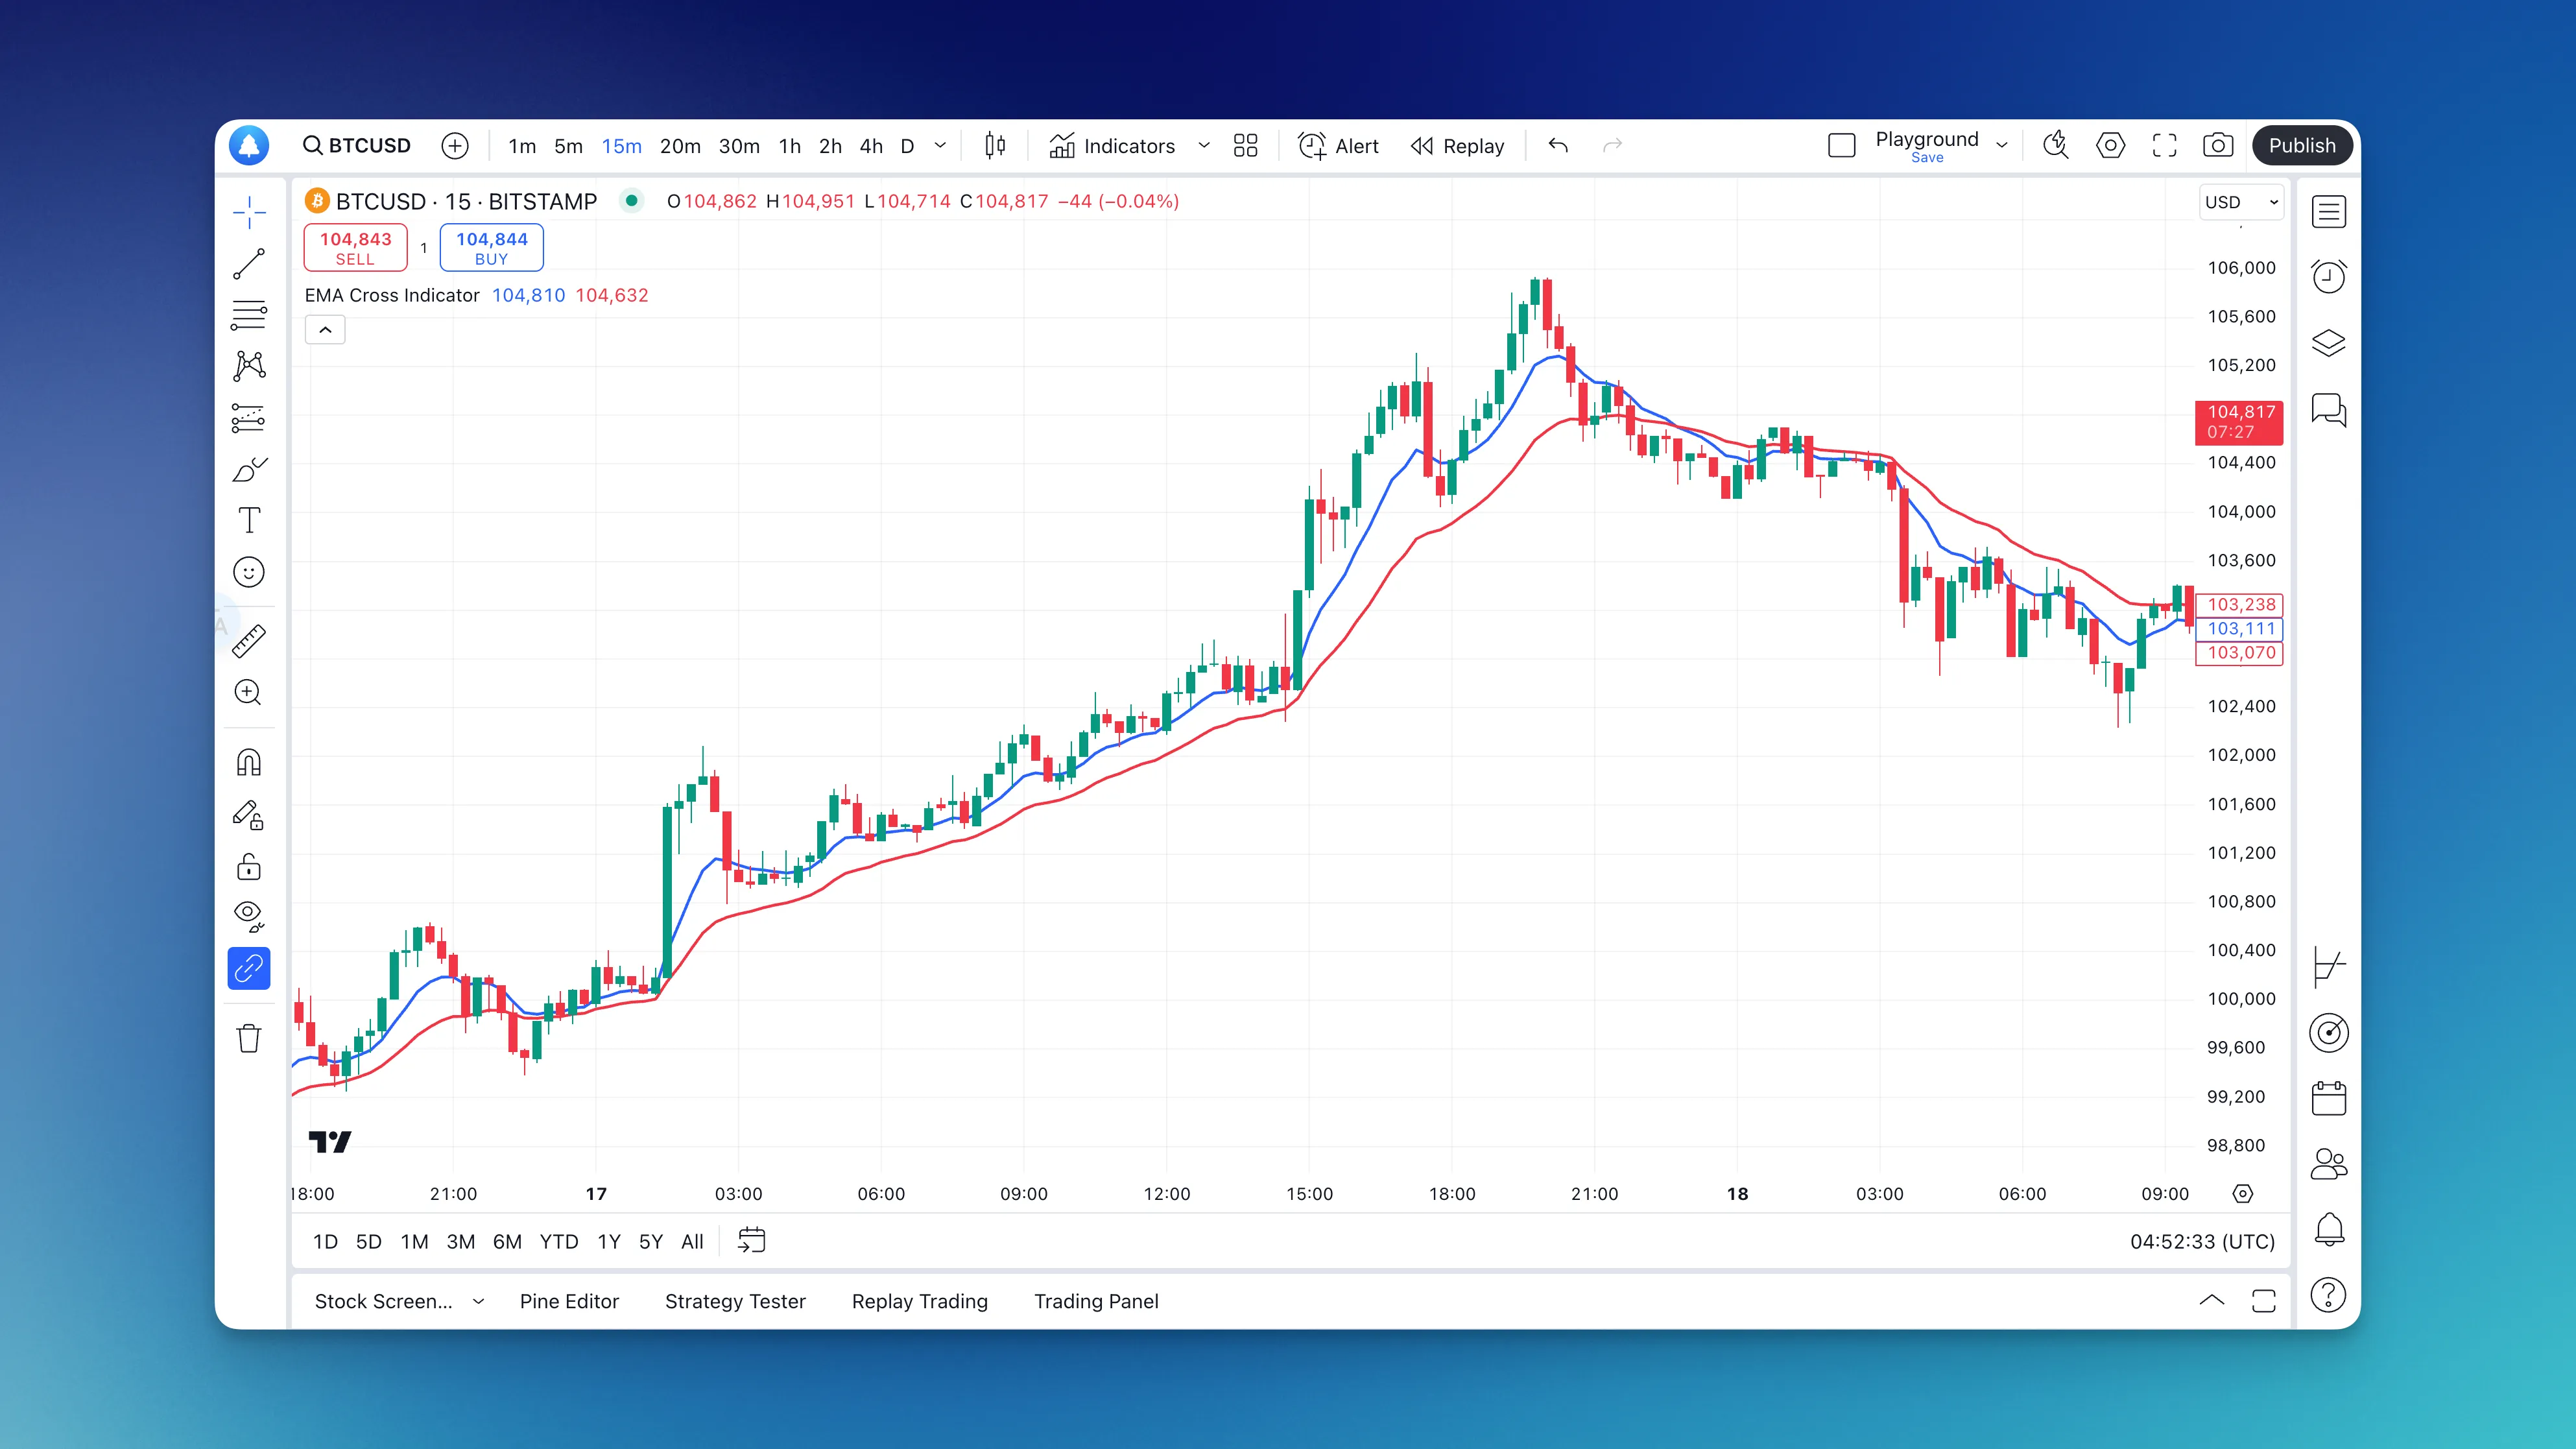
A chart overlay is exactly what it sounds like: a feature that places one asset's price chart directly on top of another's. It lets you compare two instruments on a single screen and spot correlation or relative strength at a glance. I've been using this daily for years, and it changed how I track sector rotation.
In October 2025, I overlayed SPY with XLK during a market pullback. The divergence told me tech was holding support better than the broad market — a signal that turned into a 4% swing over the next two weeks.