How to Write a Trading Strategy in Pine Script
I spent last weekend backtesting a simple MA crossover on BTC/USD. The 20/50 crossover looked amazing on 2023 data — 340% returns. Then I ran it on 2022. It lost 60%. That's when you realize backtests can lie if you only pick favorable periods.
A Pine Script strategy is a script that places simulated trades based on conditions you define, letting you test an idea against historical data inside TradingView. It's different from a regular indicator, which just draws lines. A strategy actually tracks entries, exits, and P&L.
You don't need to be a programmer to write one. I've seen people with zero coding experience put together working strategies in under an hour using Pineify's AI strategy generator.
What's the Difference Between an Indicator and a Strategy?
Think of it this way: an indicator is like a weather app that tells you it's raining. A strategy is the friend who hands you an umbrella and says "let's go inside."
Indicators draw lines and shapes on your chart. Strategies place pretend trades and tell you how much money you would've made (or lost). It's the difference between saying "this looks like a good buy" and actually pressing the buy button.
Let's Start Simple
Every Pine Script strategy starts with one line that tells TradingView "this isn't just another indicator." Instead of indicator(), you use strategy().
Here's a basic moving average strategy anyone can understand:
//@version=5
strategy("Simple Moving Average Strategy", overlay=true)

ma_length = input(20, title="Moving Average Length")
ma = ta.sma(close, ma_length)

if ta.crossover(close, ma)
    strategy.entry("Buy", strategy.long)
if ta.crossunder(close, ma)
    strategy.entry("Sell", strategy.short)
That's it. When price crosses above the moving average, it "buys." When it crosses below, it "sells."
Building Your First Strategy Step by Step
Step 1: Tell TradingView It's a Strategy
Just change indicator() to strategy(). That's the first step, and it changes how TradingView treats your script. Now it expects entry and exit commands, not just plots.
Step 2: Add Adjustable Parameters
Use input() to let people tune things without digging through code:
fast_ma = input(9, title="Fast MA")
slow_ma = input(21, title="Slow MA")
Why does this matter? The best MA length for Bitcoin might be terrible for Apple stock. Giving users control means your strategy works across more markets without modification.
What can go wrong: too many inputs can overwhelm users. I usually stick to 3-5 adjustable values max. Beyond that, people get confused and move on.
Step 3: Place Some Trades
Instead of drawing arrows, you're telling TradingView "pretend I bought here":
if buy_condition
    strategy.entry("My Buy", strategy.long)

if sell_condition
    strategy.entry("My Sell", strategy.short)
Step 4: See How You Did
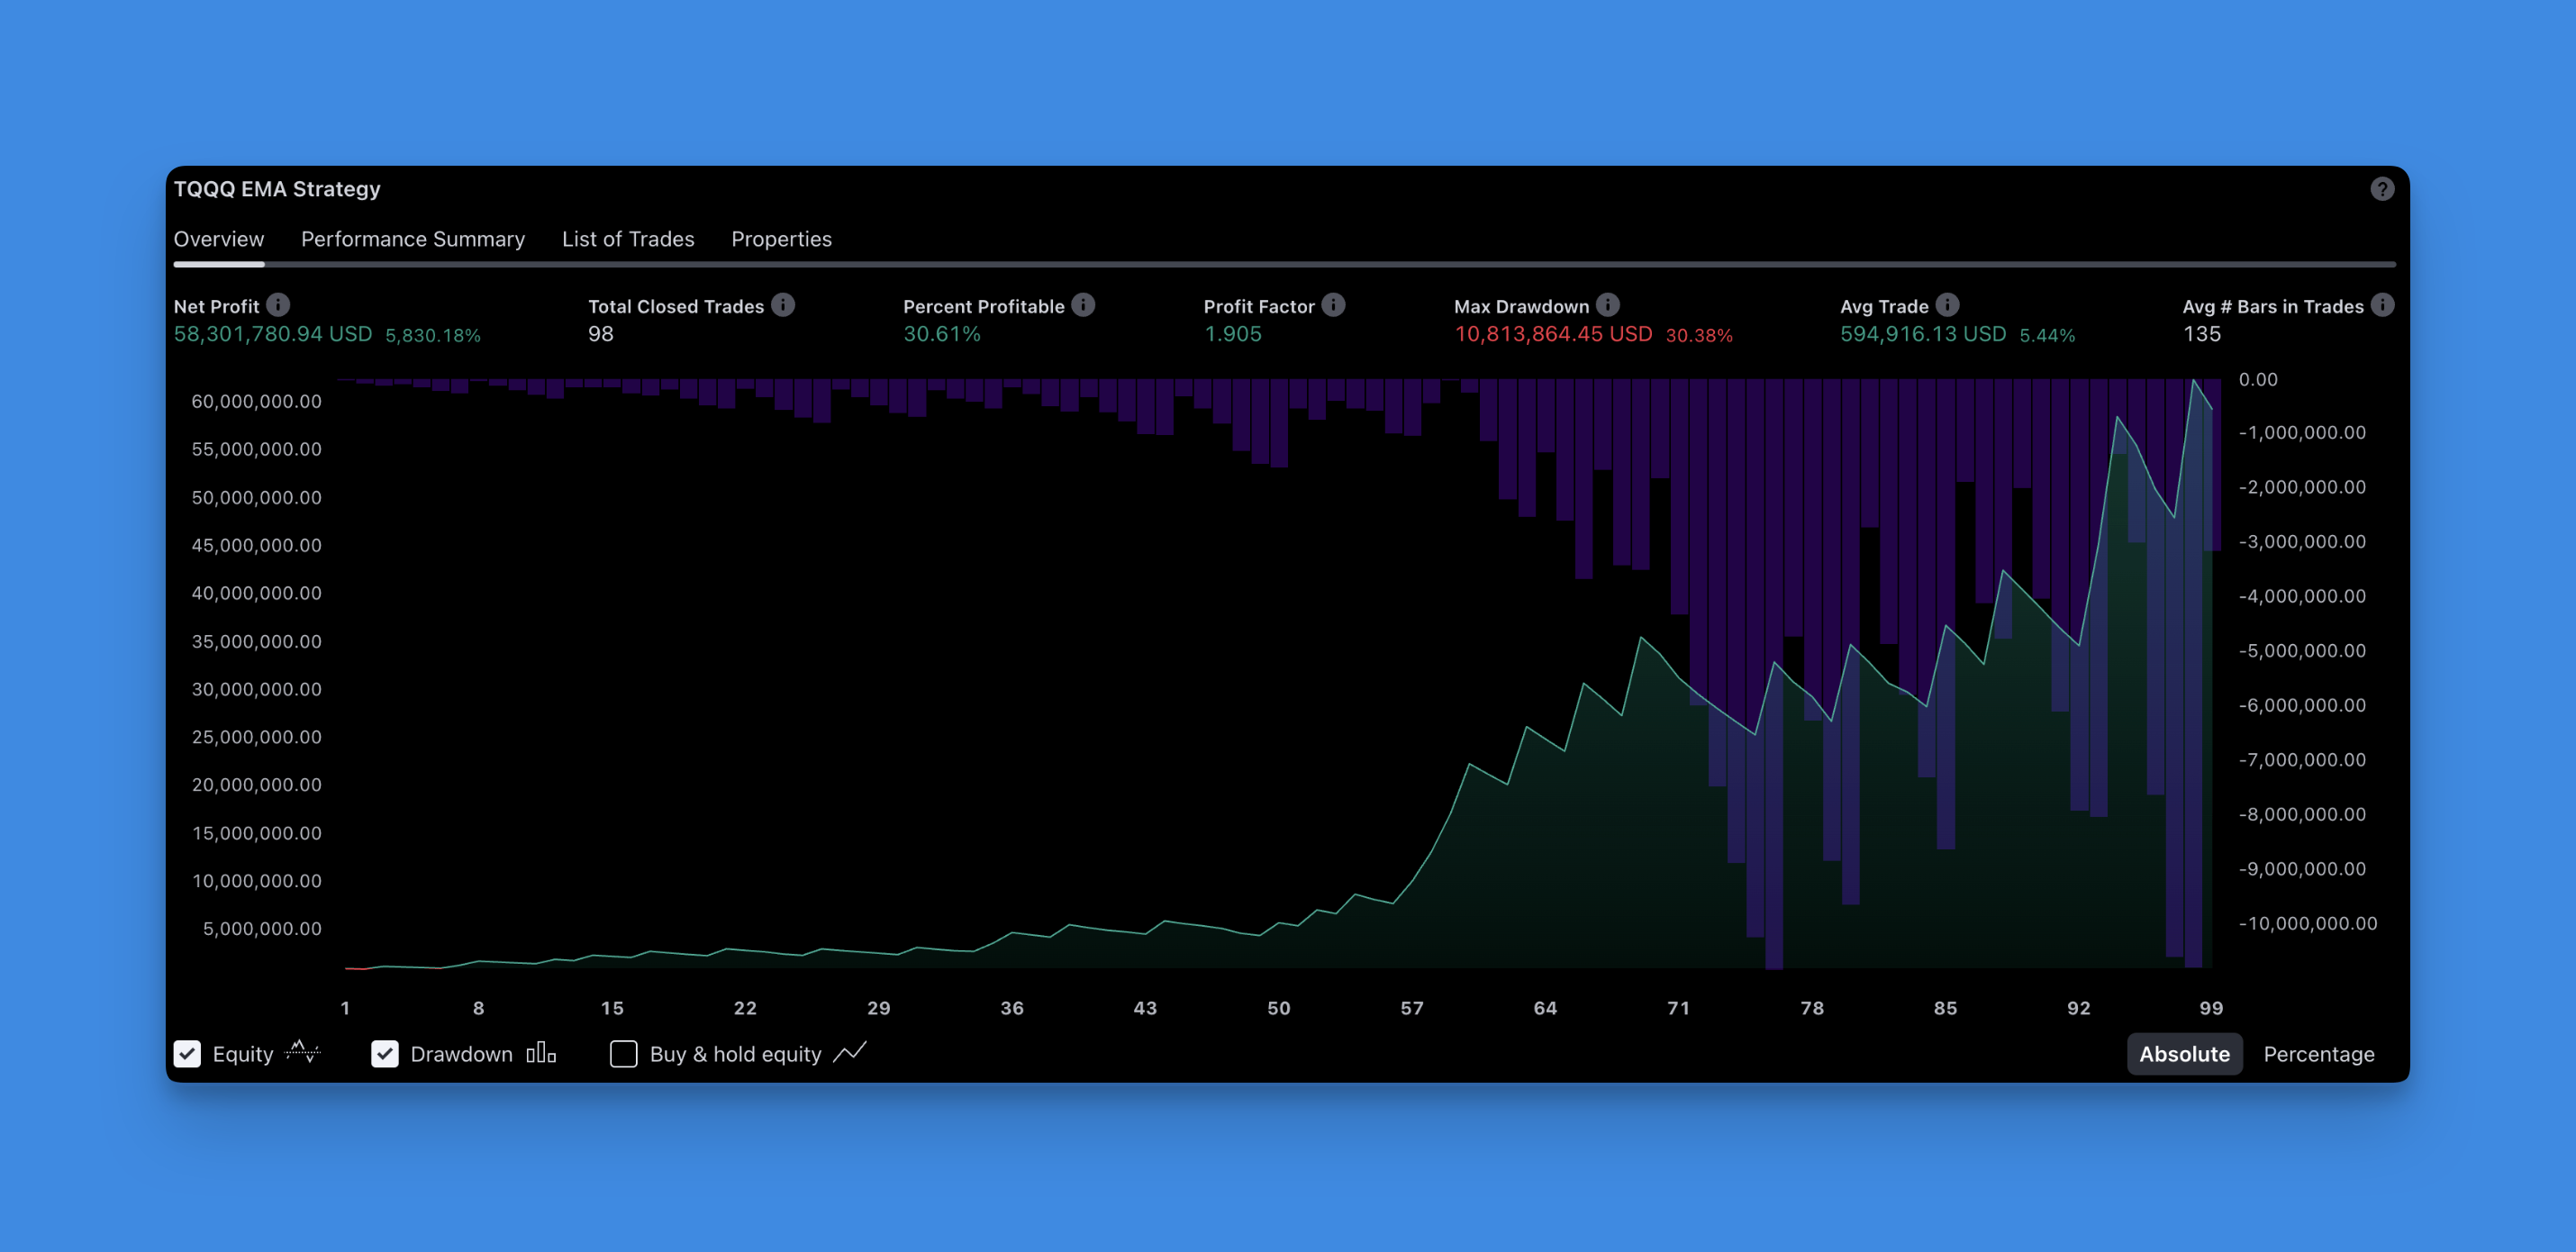
Add your strategy to any chart, then click the "Strategy Tester" tab. It shows net profit, win rate, max drawdown, and every simulated trade. I check drawdown first — a strategy with 80% win rate but 40% drawdown is riskier than it looks. For a deeper look at the building blocks, check out Pineify's strategy optimization tools.
A Real Example You Can Actually Use
Here's something I tested on ETH/USD last month. It buys when RSI is oversold and sells when it's overbought:
//@version=5
strategy("Lazy RSI Strategy", overlay=true)

rsi_length = input(14, title="RSI Length")
rsi_oversold = input(30, title="RSI Oversold")
rsi_overbought = input(70, title="RSI Overbought")

my_rsi = ta.rsi(close, rsi_length)

if my_rsi < rsi_oversold
    strategy.entry("Go Long", strategy.long)

if my_rsi > rsi_overbought
    strategy.entry("Go Short", strategy.short)

plot(my_rsi, title="RSI", color=color.blue)
Is it perfect? No. RSI alone struggles in trending markets — it'll keep you in short positions while price runs up. I prefer adding a trend filter like the 200 MA to avoid that. I haven't tested this with a filter on forex pairs yet, so I can't vouch for it there. If you want to refine the entry logic without writing every line yourself, Pineify's strategy builder can generate the boilerplate for you.
Some Things I Wish Someone Told Me
- Give your trades obvious names. "Buy123" means nothing to future you. "MA_Cross_Buy" does.
- Don't try to be clever. The best strategies are often the simplest ones.
- Test on different timeframes. What works on 5-minute charts might be garbage on daily charts.
- Keep notes. When you come back to a strategy in 6 months, you'll thank yourself.
Getting Started Right Now
You don't need to build the next big thing today. Take that simple MA strategy above, change a few numbers, and see what happens. Maybe add an RSI filter. Maybe try different moving averages.
The beauty of Pine Script is that you can test ideas in minutes, not days. Got a theory about Bollinger Bands? Code it up and see. Wondering if that crypto YouTuber's strategy actually works? Build it and find out.
Start small, iterate often, and don't be afraid to break things. The worst that happens is you lose some imaginary money in backtesting.
What is the difference between a Pine Script strategy and an indicator?
An indicator draws lines and shapes on your chart. A strategy goes further by simulating actual trade entries and exits, so you can backtest how a trading idea would've performed historically. Think of it as the difference between watching a weather report and actually bringing an umbrella.
How do I start a strategy script in Pine Script?
Replace the indicator() declaration at the top of your script with strategy(). That's it. This tells TradingView to treat the script as a backtesting strategy. You can then use strategy.entry() and strategy.exit() to place simulated trades.
How do I place a buy or sell entry in a Pine Script strategy?
Use strategy.entry("label", strategy.long) to open a long position and strategy.entry("label", strategy.short) to open a short position. The first argument is a unique trade ID you choose — something descriptive like "MA_Cross_Buy" rather than just "Buy1".
Where can I see my strategy backtest results?
After adding your strategy to a chart, click the "Strategy Tester" tab at the bottom of the TradingView chart panel. It shows net profit, win rate, drawdown, Sharpe ratio, and a full list of every simulated trade with dates.
Can I use RSI to create a simple automated trading strategy?
Yes. A common approach is to go long when RSI drops below 30 (oversold) and go short when RSI rises above 70 (overbought). The code example above is ready to copy, paste, and run. Just keep in mind RSI alone struggles in strong trends.
How do I add adjustable parameters to my Pine Script strategy?
Use the input() function. For example, rsi_length = input(14, title="RSI Length") creates a setting that appears in the strategy's inputs panel. Anyone using your script can tune the values without touching the code itself.
