Impulse MACD TradingView: Settings, Signals & Backtests
The Impulse MACD is a momentum tool that mixes a zero-lag EMA with smoothed high/low bands. In plain English: it tries to catch pushy moves a bit earlier and make them easier to read. You'll see a main histogram (the "impulse"), a signal line, and an optional second histogram (impulse minus signal). Colors shift with momentum so you can spot strong/weak up moves and strong/weak down moves without squinting.
What is the Impulse MACD Indicator?
Impulse MACD builds on MACD ideas but swaps in different parts under the hood:
- Zero-lag EMA (ZLEMA) of price sits at the core.
- SMMA bands of high and low frame momentum extremes.
- The impulse value is the deviation of the ZLEMA from the band it challenges.
- A signal line is a simple average of that impulse.
- An extra histogram shows impulse minus signal.
In practice, you get slightly earlier reads (thanks to ZLEMA) and a smoother feel (thanks to SMMA). The zero line is your pivot. Crosses of impulse vs. its signal can time entries/exits. The color "regime" helps filter noise:
- Strong Up: price above ZLEMA and above upper band
- Weak Up: price above ZLEMA but not above upper band
- Strong Down: price below lower band
- Neutral: anything else
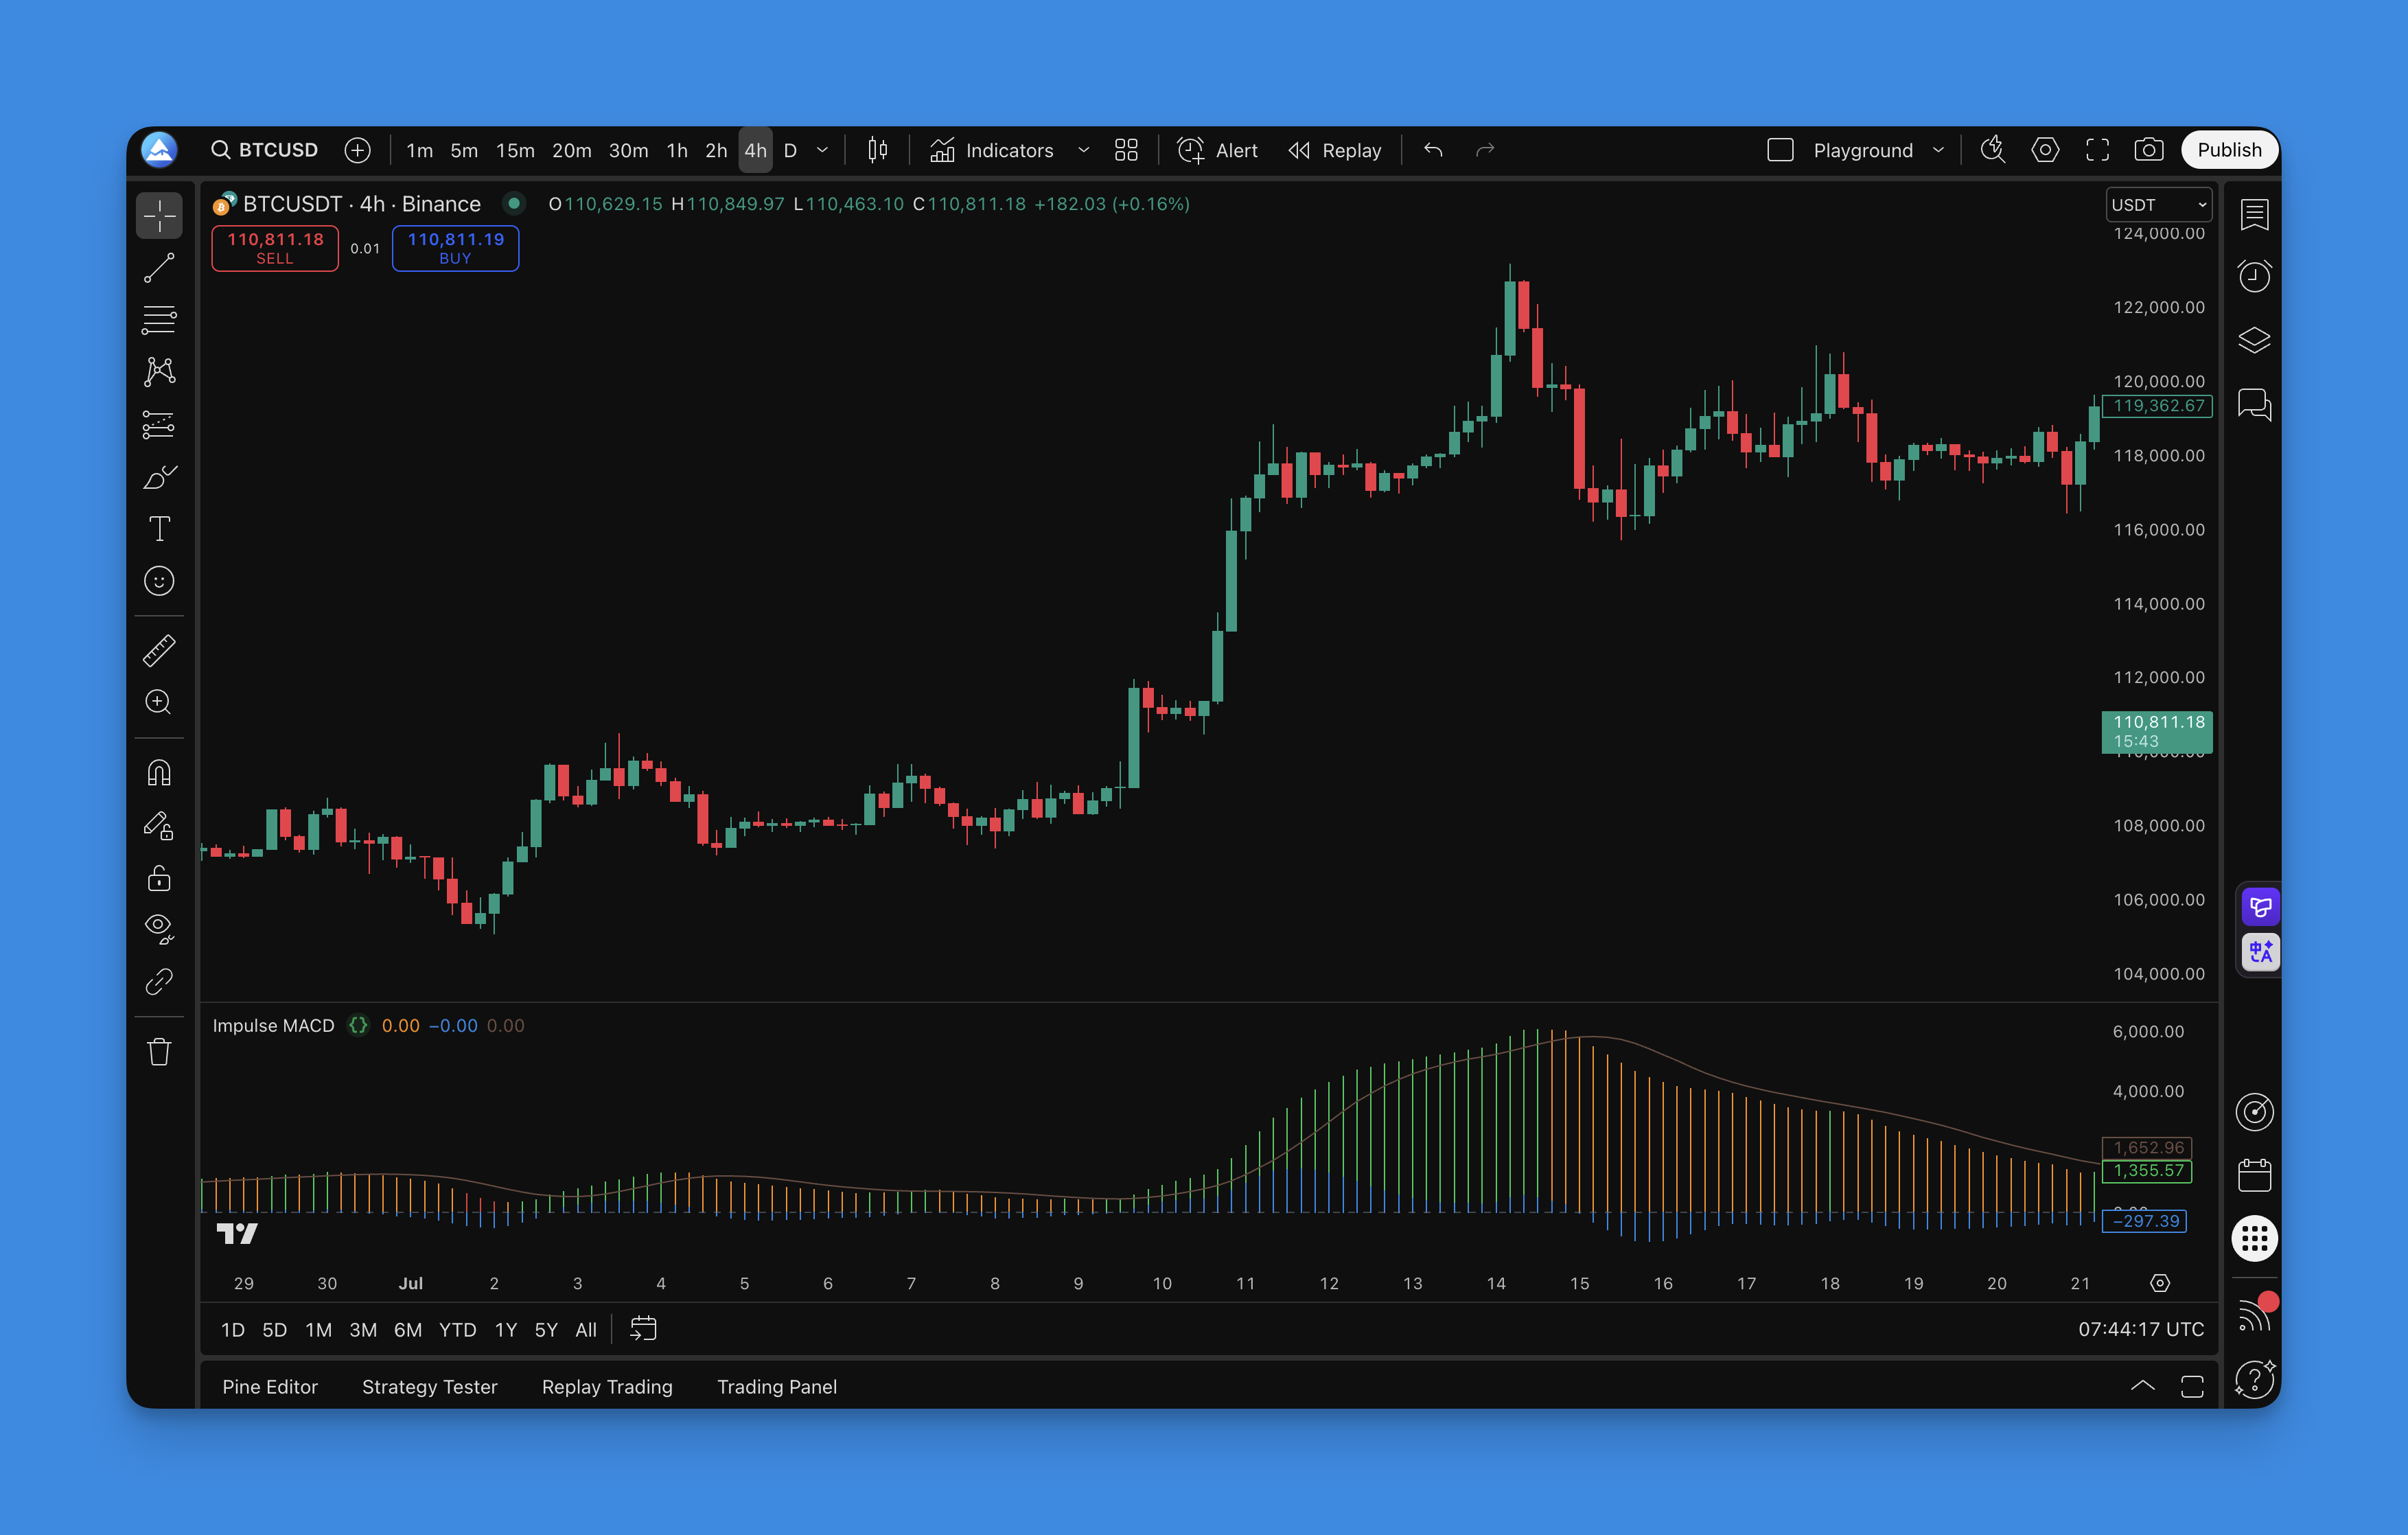
I've been running this on AAPL daily charts since November. It holds above zero during clean trends but flips hard around earnings — that's where the color regime saved me from a few bad entries. On BTCUSD 4H, I prefer a longer signal (12 instead of 9) to cut down whipsaws. I haven't tested it on forex pairs yet, so I can't say how it holds up during low-volatility Asian sessions.
How to add Impulse MACD to TradingView

Quick steps with Pineify:
- Open the Pineify editor
- Search "Impulse MACD"
- Load it and adjust inputs
- Click "Copy Pine Script"
- Paste into TradingView and add to chart

How to use Impulse MACD
- Signal line cross: bullish when impulse crosses above its signal; bearish on crosses below.
- Zero line context: above zero favors long bias, below zero favors short bias.
- Color regime: use strong/weak states to confirm or filter trades.
- Divergence: compare price swings to impulse swings for early warnings.
Practical reads:
- Trend continuation: impulse holds above zero during pullbacks, then recrosses its signal up.
- Reversal tests: a strong color flip near the zero line often starts a new move.
- Range filters: avoid signals when color flips rapidly around zero.
Best Impulse MACD Settings
Default in this script: lengthMA = 34, lengthSignal = 9.
| Timeframe | MA Length | Signal | Notes |
|---|---|---|---|
| 1-5 min | 21-34 | 5-7 | Scalping, more noise |
| 1-4 hour | 34 | 9 | Swing trading |
| Daily | 34-55 | 9-12 | Position trading |
Shorter periods give you more signals and more noise. Longer periods mean fewer signals but cleaner trends. If you want calmer plots, bump up the signal.
I threw together a quick backtest on TSLA daily from Oct to Dec 2025 with the default settings — 14 trades, 62% win rate, but the drawdown during November consolidation was rough. You'll want a higher-timeframe trend filter if you see that pattern.
How to backtest Impulse MACD
Through the Pineify editor, you can build full strategies with market orders, take profit, stop loss, and trailing stop. Start simple, measure, then refine.
Entry and exit ideas:
- Long: impulse crosses above signal while impulse is above zero; exit on opposite cross or close back under zero.
- Short: impulse crosses below signal while impulse is below zero; exit on opposite cross or close back above zero.
Risk basics:
- Place stops at last swing or use ATR. Aim for at least 1:2 R:R.
- In trends, trail stops behind structure.
FAQs
What makes Impulse MACD different from classic MACD?
It uses a zero-lag EMA and SMMA bands to read thrust. That combo responds a bit faster and feels smoother. If you want a deeper MACD refresher first, try: MACD Indicator: Master TradingView's Most Reliable Momentum Tool.
Does it repaint?
No. It uses confirmed bar values. Signals can change intrabar, but final values lock at close.
What timeframes work best?
It scales well. 1-hour to daily are clean for swings. Use shorter settings for scalps. If you like multi-timeframe reads, this version is handy: MACD Multi-Timeframe Indicator.
Can I pair it with other tools?
Yes. Pair it with a trend filter (MAs or ribbons) and a volatility lens (Bollinger or Keltner) for context. For momentum alternatives, these are popular: Waddah Attar Explosion and QQE MOD.
How do I reduce false flips?
Lengthen the signal and consider a higher MA length. Adding a higher-timeframe bias helps too.
If you want to turn this indicator into a complete strategy, this walkthrough is practical: Pine Script v6 Strategy Examples.
If you want to compare momentum tools side by side, also see: WaveTrend Oscillator.
Nothing here is financial advice. Test first and size with care.